Am Fam Physician. 2009;79(8):668-670
Author disclosure: Dr. Shaughnessy is a consulting editor for John Wiley and Sons, Inc., publisher of Essential Evidence Plus. He also is a consultant for BMJ Group and Prescriber's Letter.
Each year physicians must decide which of the thousands of newly published articles they will take time to read. To determine which articles are the most clinically useful, physicians should assess their relevance, validity, and clinical importance. Using these criteria can drastically decrease the number of articles physicians need to read.
Each year, thousands of articles are published evaluating new or existing drugs or therapies. How can doctors know which are the most clinically useful articles to read? In addition to using the information tools discussed in another article in this special article series,1 there are some basic ways to evaluate a study's relevance, validity, and clinical importance.
Assessing Relevance: Most Information Is “Not Ready for Prime Time”
The first step is to determine whether the information is relevant by answering “yes” to the following questions:
Did the study evaluate an outcome patients care about? We and our patients want to know whether a treatment helps us live longer, happier, or healthier. These are patient-oriented outcomes. Many studies evaluate surrogate or intermediate results, such as changes in laboratory values. These studies require us to extrapolate and hope that these results represent a benefit. The hazard of this approach has been demonstrated many times: treating asymptomatic ventricular arrhythmias decreases arrhythmias, but increases mortality rates2; ezetimibe (Zetia) decreases cholesterol levels, but has not been shown to affect morbidity or mortality from cardiovascular disease3; rosiglitazone (Avandia) decreases A1C levels, but may increase mortality rates in patients with diabetes.4
Did the study evaluate a condition, disease, or issue that is within the scope of your practice?
If the information is true, would the findings require you to change the way you practice? Research findings that merely confirm existing practice, even if they use patient-oriented outcomes, are lower priority.
Using these questions can drastically decrease the number of articles you need to read.
Assessing Validity: Key Terms to Know
Recognizing the key terms in research design can help us quickly identify studies that are valid. Our goal is to separate information that is useful from research that may give us the wrong impression about the results we are likely to see in practice.
The best research design is a high-quality randomized controlled trial that compares one therapy to placebo or to the standard therapy. Other study designs, such as prospective or retrospective cohort or case-control studies, often overestimate the benefit of a therapy.5
Higher-quality studies have other features as well. To avoid misleading results influenced by expectations, the study should be conducted in a double-blind manner. When a study is double-blinded, neither the investigator nor the participants know which treatment they receive until the study is complete.
A related study design is concealed allocation. Distinct from blinding, this approach prevents the investigator who enrolls patients into the study from knowing to which group the participant will be assigned (i.e., the allocation to one group or another is concealed from the recruiting researcher). Both of these study procedures help prevent investigators from intentionally or unintentionally introducing bias.
Higher-quality studies also have sufficiently long duration and complete follow-up of the enrolled participants to assure us that we are likely to see similar results in our own practices. The method of statistical analysis that is preferred is called intention-to-treat analysis. Instead of being withdrawn if they discontinue the study, in this approach participants are analyzed in the groups to which they were originally assigned, regardless of whether they took the medication or received the intervention.
Each issue of American Family Physician contains a glossary of evidence-based medicine terms (https://www.aafp.org/journals/afp/authors/ebm-toolkit/glossary.html); seeing these terms in study abstracts increases confidence that the researchers conducted their research using valid scientific methods.
Assessing Clinical Importance: Understanding the Language of Research
Obviously, it is important to know whether a treatment is effective. It is more important, however, to know how effective it is. Statistical results can be presented in many ways, and there are limitations for each type of result. Knowledge of just a few statistical terms can go a long way to help you understand research findings.
The P-value is the likelihood that the difference between two or more groups could have arisen by chance. We accept a less than 5 percent likelihood (P <.05) that the difference is the result of chance. But a P-value of .05 still means that there is a one-in-20 likelihood that the difference is a result of chance alone. The P-value does not tell us the magnitude or clinical importance of the difference. A low P-value does not equate to a big difference. It just tells us that we can be very confident that the difference was not a result of chance.
The relative risk (RR) reduction provides information on the magnitude of the difference, but not necessarily the clinical importance. The RR is the risk of harm or benefit of one treatment compared with another. If the RR is 1.0, there is no difference between therapies. RR differences can be large, even if the clinical difference is not.
A better measure of clinical importance is the absolute risk (AR) reduction. This is the simple arithmetic difference between the outcome rate in the control group and the rate in the treatment group. For example, if the rate of myocardial infarction in the control group is 2 percent and the rate in the treatment group is 1 percent, the AR reduction is 1 percent (2 – 1). The RR reduction is 50 percent ([2 – 1]/2]. Although the RR seems impressive, the AR may not be clinically relevant.
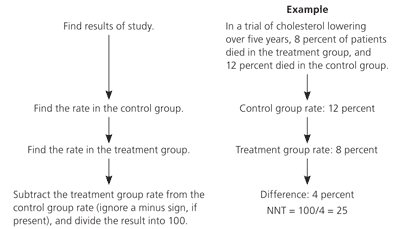
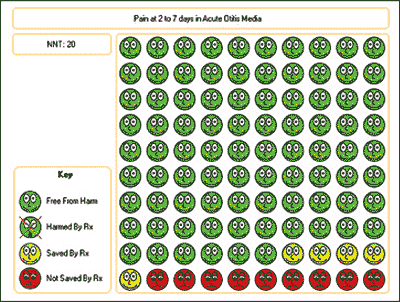
A better number to use to understand the magnitude of results is the number needed to treat (NNT). For example, in children with otalgia, the NNT for antibiotics to relieve pain within two to seven days of starting treatment is 20; one child out of 20 will benefit as the result of antibiotic treatment. NNTs for some common interventions are listed in Table 1.6 The calculation of the NNT is shown in Figure 1. The Web site http://www.nntonline.net has a calculator and displays the results in a visual format using smiles and frowns (Figure 2).7
| Condition | Treatment | Outcome* | NNT |
|---|---|---|---|
| Prevention | |||
| Hypertension in patients with type 2 diabetes | Hypertension treatment | Diabetes-related death over 10 years | 15 |
| Hyperlipidemia (secondary prevention) | Various versus placebo | Heart attack or stroke over five years | 16 |
| Deep venous thrombosis | Warfarin (Coumadin; target INR = 1.5 to 2.0) versus placebo for one year | Venous thromboembolism over one year | 22 |
| Heart failure (New York Heart Association class I or II) | Enalapril (Vasotec) versus placebo | Death at one year | 100 |
| Hyperlipidemia (primary prevention) | Simvastatin (Zocor) versus no treatment | Death over one year | 163 |
| Treatment | |||
| Helicobacter pylori infection | Triple therapy | Eradication | 1.1 |
| Peptic ulcer | Helicobacter pylori eradication therapy versus acid suppression treatment for six to eight weeks | Cure at one year | 1.8 |
| Migraine | Sumatriptan (Imitrex) versus placebo | Headache relief at two hours | 2.6 |
| Bacterial conjunctivitis | Topical antibiotics versus placebo | Early clinical remission (three to five days) | 5 |


Confidence intervals (CIs) help us understand the precision of a result. They are usually reported as a 95% CI, which indicates that we can be 95 percent certain that the true value is between the two numbers given. If the interval includes 1, the result is not meaningful, because the actual result might be more or less than the baseline. For example, if a treatment reduces the risk of myocardial infarction by 10 percent, with a 95% CI of 5 to 15, we can be pretty sure that the risk is reduced somewhere between 5 and 15 percent. But if the 95% CI is –5 to 20 percent, the treatment may increase the risk by as much as 5 percent or reduce the risk by as much as 20 percent. More studies are reporting NNTs, which is a sign that researchers are trying to do a better job of conveying the clinical importance of a treatment's effect.