If you're shopping for an EHR system, you might appreciate this advice from several hundred colleagues.

With government incentive checks for meaningful use of electronic health record (EHR) technology already in the hands of some physicians and seems high time for another survey of user satisfaction with EHR systems. As with our three earlier surveys,1–3 we published the survey instrument in an issue of Family Practice Management and made an online version available through the FPM web site.4 Again this year, in an effort to maximize responses, we kept the survey short and offered incentives for usable responses (one Apple iPad and 10 one-year subscriptions to FPM, which were awarded to randomly selected respondents). We also followed up publication of the survey with reminders in FPM e-mail newsletters and sent one e-mail reminder to most active members of the AAFP. Given the wide availability of the survey instrument, we accepted responses only from AAFP members as a way of avoiding frivolous responses, multiple responses per individual and other such potential sources of bias.
The results are not intended to be a statistically accurate picture of EHR use among AAFP members; rather, our intent was simply to collect opinions from as many users of as many EHR systems as possible and to convey the range of responses as clearly as we could in an easily digestible form.
Survey results
We were able to collect a total of 3,427 responses, far more than in previous surveys. Of those, 603 were excluded because the respondents said they did not use EHR systems; 99 were excluded because they either did not name the system they use, named a practice management system rather than an EHR system, named a “home-grown” proprietary system or named something that we could not verify to be an EHR system; finally, six were excluded because the respondents indicated that they had a significant financial interest in or affiliation with a manufacturer or vendor of an EHR program (e.g., an ownership interest, a sizable stock purchase or involvement in development of the software). That left 2,719 responses for analysis.
Respondents in the analysis group reported a total of 205 identifiable EHR systems, 175 of which were used by 12 or fewer respondents. The 30 systems reported by 13 or more respondents accounted for 87 percent of responses (2,371). These 30 systems are the ones we will provide system-specific results for, using the average of all 2,719 responses as a point of comparison. We chose to focus on these 30 systems because we believed that we had enough responses for each to represent a reasonable spread of opinions on the system. The 30 systems in question are shown in the chart titled “Distribution of survey respondents by practice size for 30 EHR systems.” (A more detailed list is available in a downloadable online appendix to this article.) The number of respondents who reported each system (or any system, in the case of “all respondents” data) is indicated in parentheses. Three of the 30 systems are government-developed EHRs. AHLTA is the Defense Department's EHR, VistA CPRS is the Veterans Administration EHR (and available as freeware under various versions called VistA), and RPMS is the Indian Health Service's EHR. We have included them for comparison purposes.
Distribution of survey respondents by practice size for 30 EHR systems
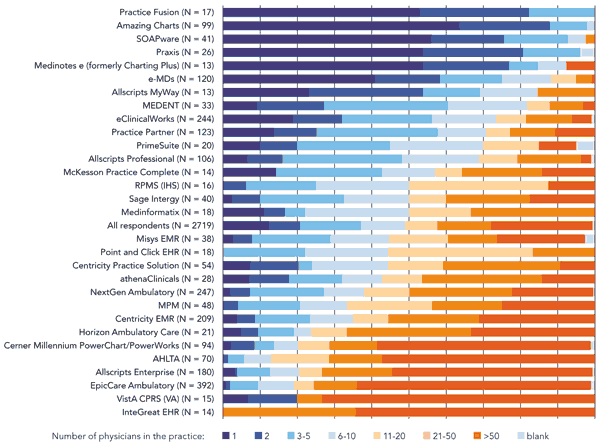
About half of respondents came from practices with 10 or fewer physicians (49 percent, or 1,334), and almost as many (42 percent, or 1,136) came from practices of more than 20 physicians, with 743 of those (27 percent of the total) coming from groups of more than 50 physicians. As we expected, certain EHR systems were reported more commonly in small practices and others more commonly in large ones. The practice-size distribution of the 30 systems is shown above. At least 67 percent of users reporting the first 12 systems shown in the chart (from Practice Fusion through Allscripts Professional) come from practices of one to 10 physicians, while at least 67 percent of users reporting the last seven systems (from Horizon Ambulatory Care through InteGreat EHR) come from practices of more than 20 physicians.
Respondents reported experience with their EHR systems ranging from a couple of weeks to more than 20 years, but the majority (53 percent, or 1,436) said they had up to three years of experience with the system they reported on. Another 43 percent (1,169) reported more than three years but less than 10 years of experience. Asked to estimate their skill in using their EHR systems, most respondents said they considered themselves average or above average but not expert users of their EHR systems (73 percent, or 1,980). It is perhaps a sign of increasing market maturation that some 14 percent of respondents have switched EHR systems at least once because of unhappiness with a prior system.
Dimensions of satisfaction
To determine users' satisfaction with various aspects of their EHR systems, we asked respondents to indicate their level of agreement or disagreement with each of the following 17 statements, using the scale Strongly Agree, Agree, Neutral, Disagree, Strongly Disagree and Feature Unavailable.
- Ordering lab tests is easy with this EHR.
- Ordering imaging studies is easy with this EHR.
- Ordering referrals is easy with this EHR.
- This EHR provides useful tools for health maintenance (for instance, prompts, alerts and flow sheets).
- This EHR provides useful tools for disease management (for instance, diagnosis-specific prompts, alerts and flow sheets).
- This EHR provides useful patient engagement tools (for instance, patient education materials, health summaries and a patient portal).
- Documenting care is easy and effective with this EHR.
- Finding and reviewing information is easy with this EHR.
- E-prescribing is fast and easy with this EHR.
- E-messaging and tasking within the office is easy with this EHR.
- I am confident that I can achieve “meaningful use” and qualify for Medicare or Medicaid EHR incentive dollars using this EHR.
- Our EHR vendor provides excellent training and support.
- This EHR enables me to practice higher quality medicine than I could with paper charts.
- Our EHR currently has the ability (whether we use it or not) to provide customized features (for instance, note templates, favorites lists and screen appearance) at the individual user level.
- Overall this EHR is easy and intuitive to use.
- I am highly satisfied with this EHR.
- If I were in the market to buy a new EHR now, this is the EHR I would buy.
Preliminary ranking
For a rough, preliminary sense of the survey results, we ranked the 30 systems by the percentage of respondents who indicated that they agreed or strongly agreed with each of the statements. The results are shown in “Survey overview: 30 EHR systems ranked on 17 dimensions.” To help make sense of the array of numbers, the highest five rankings for each statement are tinted green and the lowest five are tinted orange. The systems are listed by the sum of their ranks.
While this is a fairly crude ranking, it does offer some useful insights. First, the high and low rankings do tend to cluster in certain systems, as the areas of green and orange on the chart suggest. Second, the systems most commonly reported by physicians in small practices tend to cluster at the top of the rankings, while those most commonly reported in large practices tend to cluster at the bottom of the rankings. We have reason to believe that practice size is independently related to satisfaction,5 so this may not be due entirely to the qualities of the EHR systems themselves. Given that clustering, though, it's interesting to note that two systems commonly reported in small practices – Allscripts MyWay and Medinotes e – are ranked toward the bottom. This may suggest that one of the top-ranked systems might be a better bet for small practices. Conversely, two systems commonly reported in large practices – EpicCare Ambulatory and VistA CPRS – show up near the top of the rankings. In our 2009 survey, Medinotes e ranked similarly low and EpicCare Ambulatory ranked similarly high; neither Allscripts MyWay nor VistA CPRS were included in the system-specific results then, however.
SURVEY OVERVIEW: 30 EHR systems ranked on 17 dimensions

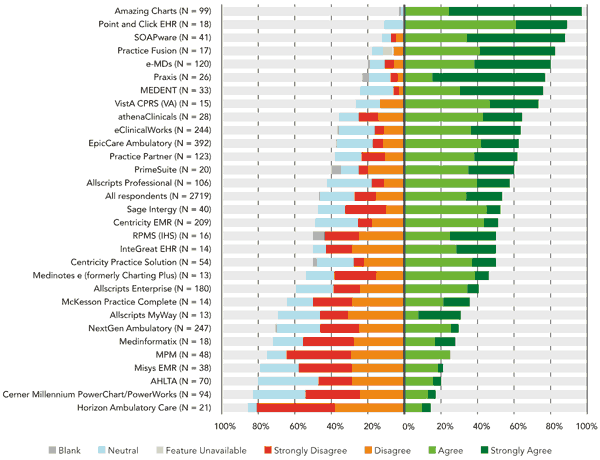
Response spectrum charts
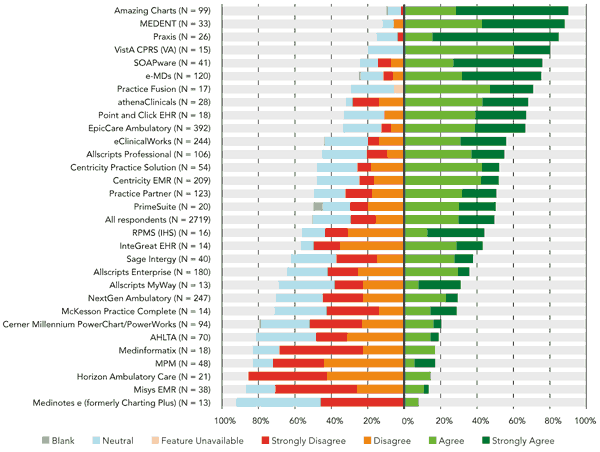
The ranking table does obscure the details of responses for each statement. To better visualize the full range of responses, we turn to charts like “Response spectrum: ‘Overall this EHR is easy and intuitive to use.’” Each bar in a response spectrum chart represents 100 percent of responses for a given system (or for all systems reported, in the case of the “All respondents” bar), so all bars on the chart have the same overall length. The bars are divided into sections representing, from left to right, Blank (respondents who left the item blank, if any), Neutral, Strongly Disagree, Disagree, Agree and Strongly Agree.
Bar segments for Blank and Neutral are positioned to the left and given only light tints to help highlight the segments representing active agreement or disagreement. Keep in mind, however, that these segments do not represent negative responses and could as easily have been placed on the far right end of the bars. The bars are positioned so the dividing line between agreement and disagreement falls on a midline, so bars that fall mostly to the right of the midline represent a predominance of agreement with the statement, while those that fall mostly to the left indicate a predominance of disagreement. Bars are ordered by the sum of Agree and Strongly Agree responses so that the systems with the most positive responses appear toward the top of the chart. To interpret the chart, though, you need to look at individual bar segments, not just the order of the bars. For instance, while Praxis shows up in sixth place on the list, it received a particularly high percentage of Strongly Agree responses – 62 percent. The only system with a higher percentage was Amazing Charts, which had 73 percent Strongly Agree responses in addition to 24 percent Agree, for an overall 97 percent positive response. At the other end of the range was Horizon Ambulatory Care, with 10 percent of users agreeing that it is easy and intuitive to use and only 5 percent strongly agreeing. It also helps to note the position of the “All Respondents” bar in the chart, since you can think of systems appearing above that bar as receiving above-average responses and those below that bar as receiving below-average responses.
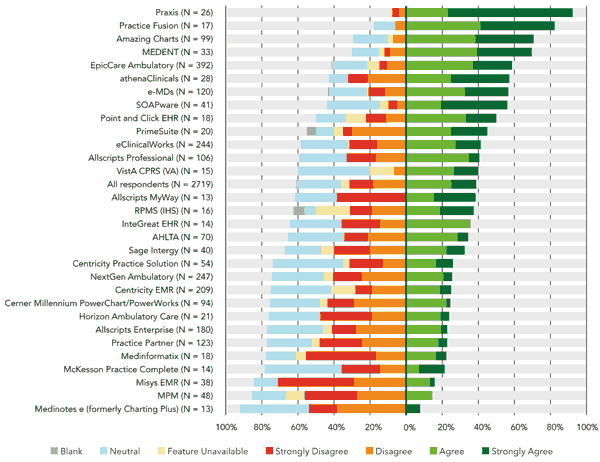
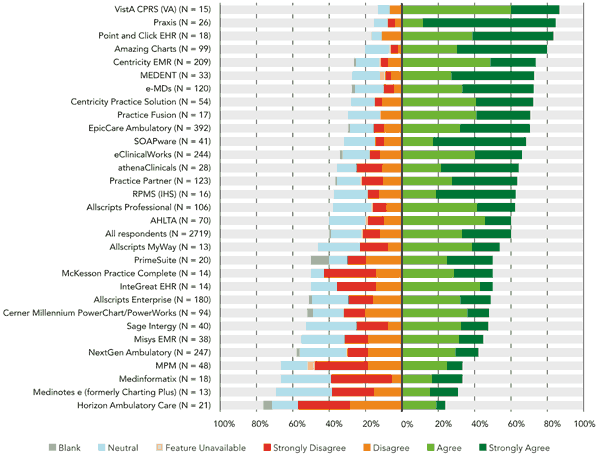
While we have room to display only a few response spectrum charts in the following pages, an (appendix available for download from the online version of this article does provide all 17, plus a summary chart, which sums responses to all 17 items in each bar segment, and charts of results for other questions asked on the survey. The charts we've selected to include here display results for four qualities that seem particularly likely to be important to anyone selecting a system – ease of use, vendor support, the system's contribution to quality of care and overall satisfaction. The same systems tend to show up at or near the top and at or near the bottom of all four charts, as you'd expect from the ranking table, but the charts show more. For instance, you'll note that a number of systems on the “training and support” chart have particularly large bar segments for “feature unavailable,” suggesting that the availability of support is something to look into extra closely if you're interested in one of those systems. Checking the performance of a given system on each chart can also be enlightening. For instance, while Horizon Ambulatory Care shows up at the bottom of the “easy to use” chart and the “higher quality medicine” chart, respondents were apparently a good deal more negative about its ease of use than its contribution to quality, as you can tell from the lengths of the disagree and strongly disagree segments.
RESPONSE SPECTRUM: ‘Overall this EHR is easy and intuitive to use.’
RESPONSE SPECTRUM: ‘Our EHR vendor provides excellent training and support.’
RESPONSE SPECTRUM: ‘This EHR enables me to practice higher quality medicine than I could with paper charts.’
RESPONSE SPECTRUM: ‘I am highly satisfied with this EHR.’
Some overall observations
Looking at overall data from all 2,719 qualified responses is instructive. The aspects of EHRs that users are most satisfied with are the ability to customize them, do e-prescribing and do e-messaging (78 percent, 70 percent and 69 percent overall positive satisfaction respectively). The area of lowest satisfaction is EHR vendor support and training; only 39 percent were satisfied or very satisfied, 31 percent were dissatisfied or very dissatisfied and 25 percent were neutral. Clearly vendors have some work to do in this area. Finally, overall satisfaction with EHRs is a mere 50 percent (with 30 percent dissatisfied) and only 38 percent of users agree or strongly agree that they would purchase their system again. It appears that there is a lot of room for improvement in the EHR product world.
CMS certification for EHR incentives
Of the 30 products, seven were not certified by the Centers for Medicare & Medicaid Services (CMS) as complete EHR products capable of “meaningful use” for the purpose of receiving CMS incentive payments as of May 28, 2011. One of the most popular products, Praxis, had not yet been certified by that date, yet surprisingly 85 percent of its users said they were confident that they would qualify for incentives. Another EHR, Practice Fusion, has quali-fied only as a modular product – meaning that, used just by itself, it was not enough to qualify for meaningful-use dollars. MediNotes e and Misys EMR were not certified, nor was Point and Click, a student health EHR. Finally, AHLTA and VistA CPRS had not yet been certified.
Caveats
As in past surveys, our goal was not to pick clear “winners” in terms of user satisfaction. The system characteristics covered in the survey may have different weights for different practices. Practice size especially seems to be an important enough consideration that it would make no sense to say that Praxis or Amazing Charts is “better than,” say, InteGreat, EpicCare or any other system reported mostly or entirely by respondents in large groups.
In addition, this survey shares several limitations with earlier surveys in this series. That respondents were self-selected may mean that the survey attracted EHR enthusiasts, or at least physicians with particularly strong feelings about their EHRs, positive or negative. Moreover, cell size is a problem in two senses. By considering only systems for which we had 13 or more respondents, we necessarily omitted numerous systems; on the other hand, by including systems for which we had as few as 13 respondents, we risked additional bias. Still another potential source of error is that we did not report separately on different versions of the same product. This was due largely to the fact that more than 50 percent of respondents apparently did not know their product's version number. As we said to begin with, it's probably best to consider the survey results as input you'd get from a large number of colleagues who volunteered informally to report on their EHR experience. That said, we believe that the results presented in this article and its online appendix can help any family medicine practice considering the purchase of an EHR system. We hope you find them useful.