The QRUR is essentially an annual report card, and its data can affect how you get paid in the future.
Through its Physician Feedback Program, the Centers for Medicare & Medicaid Services (CMS) now creates annual Quality and Resource Use Reports (QRUR) for practices. The report shows how the quality and cost of care you provide to your Medicare patients compare with your peers' performance. You can think of your QRUR as a Medicare “report card,” which can guide practice improvement.
In September 2015, CMS made QRURs available to solo physicians and physician groups that provided services to Medicare patients in 2014 and had at least one eligible case for the quality or cost measures included in the QRUR. Data is reported by Taxpayer Identification Number (TIN); this is how CMS identifies a practice and its patients. CMS considers two or more providers as a group, and the QRUR will provide performance information only at the group level, not at the individual level.
The report is worth paying attention to because it indicates how you will fare under Medicare's Value-Based Payment Modifier (VBPM) program. The VBPM program adjusts a physician's Medicare payment based on quality and cost (or resource use). This shift from volume of care to value will soon be the new reality of how physicians get paid. Under the VBPM, solo physicians or groups whose quality and cost scores are high could be eligible for a bonus to their Medicare reimbursement. On the other hand, solo physicians or groups whose quality and cost scores are low could face penalties that decrease their Medicare reimbursement.
The VBPM penalties are in addition to the payment cuts associated with failing to successfully report to the Physician Quality Reporting System (PQRS) or attest to the Medicare Electronic Health Record (EHR) Incentive Program know as “meaningful use.” The cumulative effect of these penalties could be up to a 9 percent reduction in a practice's Medicare reimbursement, greatly affecting the bottom line.
The QRUR you received this fall contains quality performance data from 2013 and cost performance data from 2014, which will be used to calculate your VBPM for the year 2016 if your practice has 10 or more providers. Solo physicians and groups with fewer than 10 providers will be subject to the VBPM starting in 2017 based on their 2015 performance data, which will be reported in next year's QRUR. In other words, the care you are delivering today can potentially affect your Medicare reimbursement in 2017.
That said, the QRUR can be complex and confusing to understand. Using a de-identified QRUR from a group practice as an example, this article provides a guide to help you better navigate and interpret your report.
How do you access your QRUR?
Obtaining the QRUR can be challenging and frustrating. First, if you have not done so already, you or one person from your group will need to obtain an account from the new Enterprise Identity Management (EIDM) system. Instructions for obtaining an EIDM account are available on the CMS website.
Once you have the necessary EIDM account, proceed to the CMS portal, select “Login to CMS Secure Portal,” and log in. When accessing your QRUR for the first time, choose the “PV-PQRS” tab at the top of the screen and then select the “QRUR-Reports” option from the dropdown menu. At this point, you can select the year (e.g., 2014) from the “Select a Year” dropdown menu and the QRUR report you want from the “Select a Report” dropdown menu. After attesting to how you will use your data, choose one taxpayer identification number from the available TINs listed, click “Run Document,” and wait several seconds while the system generates your QRUR.
The CMS website provides additional technical assistance, guidance, and help-desk support on accessing your QRUR.
What's in the report?
The report provides a variety of quality and cost information. For instance, a quality composite score and a cost composite score indicate your practice's overall performance compared to the average of your peer group, or benchmark, and determine whether any VBPM payment adjustments apply to your group. More specifically, these overall scores are composed of PQRS measures submitted the previous year, three CMS-calculated outcome measures, and claims-based cost measures. The report contains several tables (called “exhibits”) that indicate your practice's performance compared with the benchmark, how the VBPM will apply to your practice, and the number of attributed Medicare patients and providers billing services under the group. CMS attributes, or assigns, patients to you or your group through claims data that identifies where patients received most of their primary care services. Additionally, supplementary tables allow a deeper dive into the data.
Performance highlights. This is the first page of information in the QRUR, giving you a snapshot of your quality and cost composite scores and the average of the two shown in a scatter plot diagram. The performance data is shown in comparison with your peers, and CMS uses this comparison to apply the VBPM to the group. High performance, which is eligible for a VBPM bonus payment, is defined as having a composite score greater than 1.0 standard deviation above the mean for quality or greater than 1.0 standard deviation below the mean for cost. Average performance, which receives no payment changes under Medicare, is defined as having a composite score between 0 and 1.0 standard deviation from the mean for quality and between 0 and −1.0 standard deviation from the mean for cost. Low performance, which may result in a VBPM penalty, is defined as having a composite score of more than 1.0 standard deviation below the mean for quality or more than 1.0 standard deviation above the mean for cost.
Looking at the example practice's QRUR, the “Performance highlights” indicate that this practice's performance scores are average on quality at −0.35 and average on cost at −0.04. The scatter plot diagram offers a different method of displaying the same information and averages the two scores to indicate the practice's performance among the peer group.
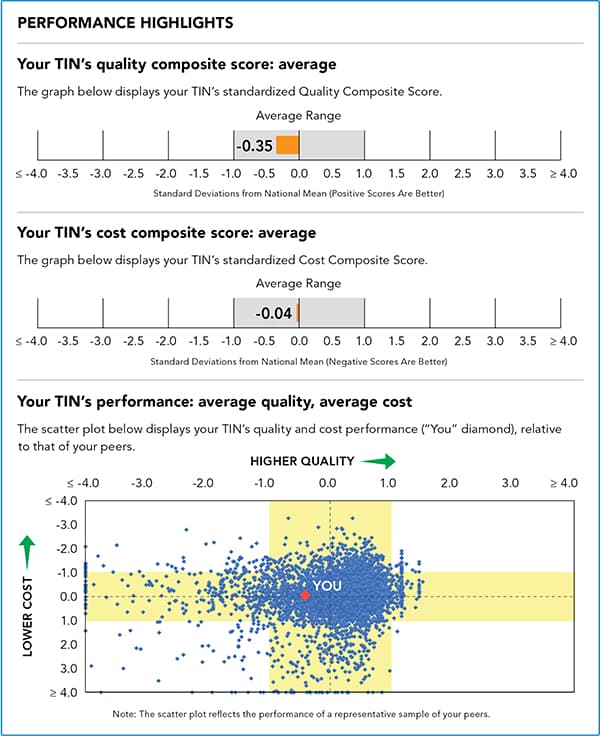
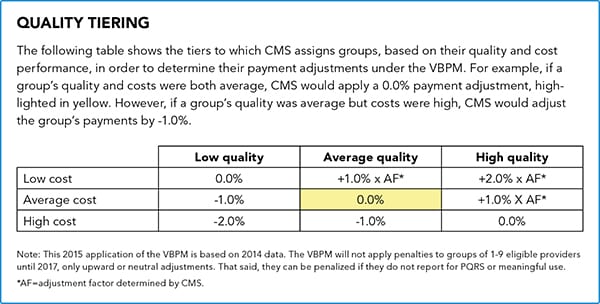
Using these scores, CMS assigns one of nine quality tiering ratings to the group and uses this rating to apply the VBPM. Because this practice's scores are average for both cost and quality, as shown in yellow, it would not receive a bonus or a penalty.
Benchmarking and risk adjustment. CMS uses benchmarks to compare your quality and cost measures against your peers. The benchmark for each individual quality and cost measure is the weighted mean of all eligible TINs, or eligible groups. For quality and cost performance at the composite level, CMS defines peer groups by the number of eligible professionals billing under the TIN or group. For example, groups with 10 or more eligible professionals are compared with all groups nationwide that have 10 or more eligible professionals. For groups with fewer than 10 providers, the peer group is composed of all groups for which the cost and quality composite scores were calculated. Remember, groups with fewer than 10 providers are not yet subject to the VBPM, so their performance does not currently affect their payment.
Recognizing that physicians and groups should not be penalized for factors outside of their control, CMS risk-adjusts quality outcome measures and cost data to account for differences in patient characteristics while also standardizing cost data to account for geographic variation and specialty.
Last, the QRUR includes quality and cost measures counted toward VBPM only if there are at least 20 eligible cases or patients attributed to that measure. Medicare has determined that this is the threshold for statistical significance when determining performance.
Quality composite score. This summarizes performance on PQRS measures that were reported in the previous year (2013 in this case), claims-based outcome measures, and, if applicable, measures from the Consumer Assessment of Healthcare Providers and Systems (CAHPS). Note, however, that if you reported for PQRS in 2014 through a qualified clinical data registry or with the EHR reporting option, those measures are not included in the 2014 QRUR because CMS was unable to validate the data.
The claims-based outcome measures include 30-day All-Cause Hospital Readmission; the Acute Ambulatory Care Sensitive Condition (ACSC) Hospitalization Rate Composite, which includes bacterial pneumonia, urinary tract infection, and dehydration; and the Chronic Conditions ACSC Hospitalization Rate Composite, which includes diabetes, chronic obstructive pulmonary disease, and heart failure. Even if you provide care only in an ambulatory setting, this information is important in understanding your patients' hospital utilization. Additionally, the use of CAHPS is not required by all groups and only applicable to those that elected to use their 2014 CAHPS in the calculation of their 2016 VBPM.
As shown in Exhibit 5, CMS assesses your quality performance in six quality domains contained in the National Quality Strategy:
- Effective clinical care,
- Person and caregiver-centered experience and outcomes,
- Community/population health,
- Patient safety,
- Communication and care coordination,
- Efficiency and cost reduction.
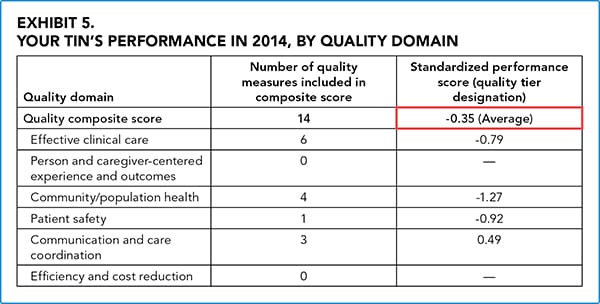
The outcomes are weighted and equally distributed to give you a score for each domain as well as an overall quality composite score. This standardized composite score is the most important part of Exhibit 5 in the QRUR as it shows how much a group's average score differs from the national mean and affects the VBPM. Positive scores reflect higher quality while negative scores reflect lower quality. In the example, this group scored −0.35, indicating an average quality score. If the difference between the group's quality composite score and the national mean is not statistically significant, the report will note having “insufficient data” and categorize the composite score as average.
You will notice that the practice in the example lacks scores for the domains of “person and caregiver-centered experience and outcomes” and “efficiency and cost reduction.” Depending on the PQRS measures you reported, there may be domains that do not contain quality measures. CMS does not count these domains toward the group's composite score; only the domains with measures are used to calculate the standardized score.
The QRUR's Exhibit 6 further breaks down the group's performance on quality measures and how it compares to benchmark rates. Be sure to review all the measures included in Exhibit 6 to determine if you're meeting your internal goals or the benchmarks set by CMS. Any negative quality score indicates underperformance compared with the peer group and is an opportunity for improvement. If you're striving to receive a bonus under the VBPM, aim for the score under the “Benchmark +1 standard deviation” column.
Let's look at an example of performance results in the community/population health domain. As indicated by the green box, this practice's performance on the “Preventive care and screening: influenza immunization” measure was 46.39 percent, exceeding the benchmark rate of 40.89 percent. This group is on its way to high performance, which is a score higher than 68.58 percent. To achieve that high performance, this group may need to implement a combination of quality improvement interventions such as pre-visit planning (see the article “Putting Pre-Visit Planning Into Practice”), recall reminders, or standing orders.
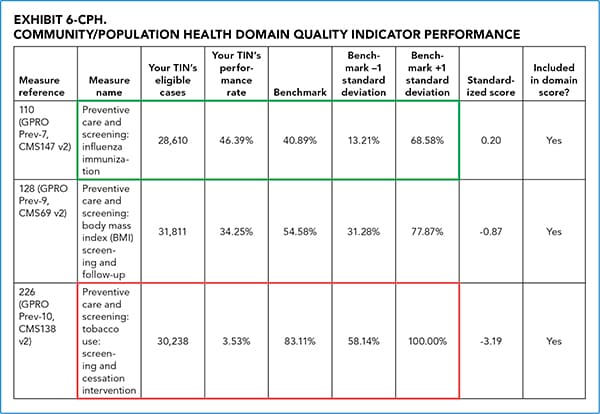
For comparison, look at the practice's performance on “Preventive care and screening: tobacco use: screening and cessation intervention,” indicated by the red box. The practice's performance was 3.53 percent, much lower than the benchmark rate of 83.11 percent and well below the low-performance threshold of benchmark -1 standard deviation. This indicates that the group needs to analyze this area and then develop a plan to dramatically improve performance.
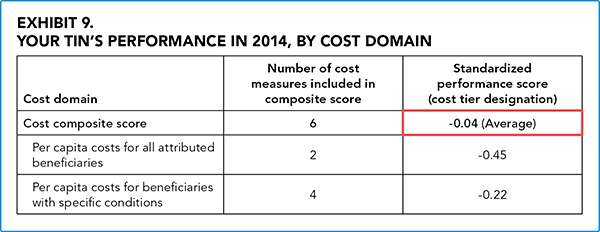
Cost composite score. This is derived from Medicare fee-for-service information for patients assigned to your group. It includes five per capita costs for all Medicare patients attributed to the group; per capita costs for Medicare patients attributed to your group with specific conditions (i.e., diabetes, chronic obstructive pulmonary disease, coronary artery disease, and heart failure); and the Medicare Spending per Beneficiary cost measure, which assesses the cost to Medicare of services performed by the group during episodes that include the period immediately prior to, during, and following a patient's hospital stay. Costs include those for inpatient and outpatient hospitalizations, skilled nursing facility stays, home health services, hospice, and durable medical equipment. Note that all costs are included for the attributed beneficiary, regardless of who provided the service.
CMS calculates the cost composite in Exhibit 9 using the same methodology it uses for the quality composite. However, CMS calculates the benchmark from the current year (2014, in this case), not the previous performance year as it does for the quality score. Also unlike the quality scores, negative scores are the goal, reflecting lower costs, while positive scores reflect higher costs. Remember, to be considered a high performer in terms of cost, the group must be 1.0 standard deviation lower than the peer group average. Looking at the example group's Exhibit 9, the group scored -0.04, which is slightly better than the mean but still designated as average. Once again, if the difference between the group's cost composite score and the benchmark is not statistically significant, the report will note having “insufficient data” and categorize the composite score as average.
The QRUR's Exhibit 10 breaks down each cost category, illustrating the group's performance, the benchmark, and the standardized scores that make up the cost composite. To be considered for a bonus, a practice should aim for the “Benchmark -1 standard deviation” scores, indicated in green in the example Exhibit 10 above. In the case of the example practice, all of its cost outcomes were slightly lower than the benchmarks (as indicated in red) but not quite in high-performance territory.
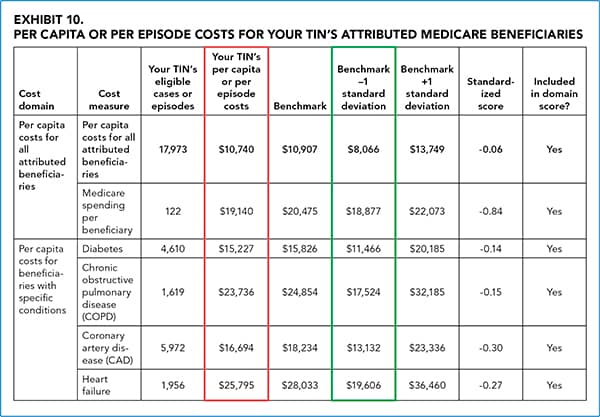
The group should consider using the Supplementary Exhibits, which can be separately downloaded through the CMS portal, to identify high-cost patients who may benefit from enhanced care coordination or care management services to help further reduce resource utilization. Additionally, the group should use the Supplementary Exhibits to confirm that all of the providers included in the report are actually a part of their group.
Putting the report to use
Medicare did not make these reports easy to interpret, but the information contained in the QRUR has never been more important. As Medicare shifts from a system that rewards volume of service to one that rewards quality and efficiency, physicians will need to prepare themselves for success. The QRUR can serve as a resource to navigate this transition because it pinpoints where a practice is doing well and where it needs improvement.
Because of the VBPM, real money is on the line. Use the QRUR to your advantage to target improvement strategies, avoid penalties, and potentially receive a bonus.