Am Fam Physician. 2002;65(9):1941-1942
In May, 2000, the Centers for Disease Control and Prevention (CDC) published revised growth charts for children to replace those published in 1977. The revised charts, accompanied by a technical report, are available on the Internet atwww.cdc.gov/growthcharts.
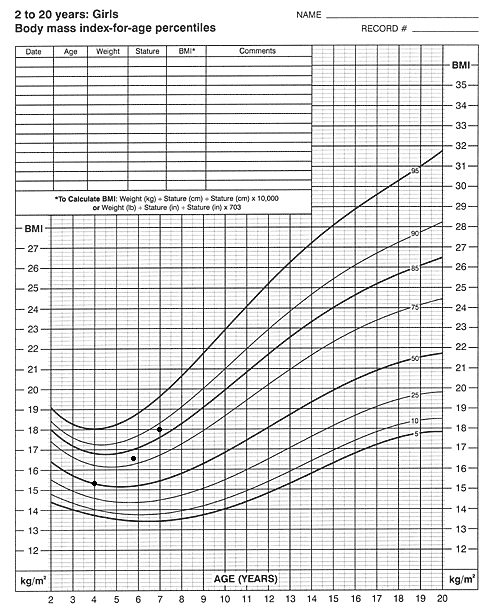
For the first time, the charts include body mass index (BMI) for children two to 20 years of age. Defined as weight divided by the square of height, the BMI correlates with body fat in measurements of body composition and therefore indicates overweight. The charts show how BMI varies with age (see Figure 1 for a sample chart). The 85th percentile line represents “at risk of overweight” and the 95th as “overweight.”
Finding BMI from weight and height is more difficult for children than for adults because there is a wider range of those measures. In clinical settings, BMI can be derived in four ways: with a pocket calculator; with an online calculator available at the CDC Web site; with a table available there; and with a personal digital assistant (PDA), using the program STAT Growth Charts (available at no charge fromwww.statcoder.com).
The revised charts include three other new features: (1) the age range has been extended to the 20th birthday; (2) although clinicians will generally use charts with the 5th and 95th percentile lines, charts showing the 3rd and 97th percentiles, for cases at the extremes of growth, are also available at the Web site; and (3) a statistical program, Epi Info, available at the Web site, enables physicians to calculate exact percentiles and standard-deviation score (z-scores) for statistical summaries and comparisons.
The revision provides technical improvements in the infant charts. The old charts were based on a small sample of children from 1929 to 1975; the revised charts are based on five recent, ethnically diverse, national samples. The old charts were based largely on bottle-fed infants; the revised ones include infants who were breastfed. The old charts had a disjunction when they went from the infant sample, based in Ohio, to the national sample for older children; the revised charts are all based on national samples, so there is no disjunction between the charts for infants and those for older children.
Training modules in the use of the charts are available at the same Web site. One module gives instructions and practice in calculating and graphing the BMI. The module on proper weighing and measuring emphasizes the use of a length board for infants and a wall-mounted stadiometer for older children. The module on poor growth in young children emphasizes using the back of the growth chart (head circumference, weight for length) to aid in the assessment of failure to thrive in infants and toddlers. Other modules address growth in head size, changes in BMI during adolescence, special-needs children, and summarizing and comparing the growth of groups of children.
