
Managing practice finances
Learn to calculate key metrics for revenue cycles and measure the efficiency of your practice.

- On this page
- Days in A/R
- Adjusted collection rate
- Denial rate
Understanding revenue cycle management in health care
The financial success of your practice can’t be evaluated through cash flow alone—it’s just one of several important factors. Revenue cycle management refers to all the activities that occur before, during and after a patient’s visit that effect a practice’s ability to get paid.
Key metrics of revenue cycle management in family medicine
Revenue cycle management includes:
Days in accounts receivable (tracking claims)
Adjusted collection rate (making sure payment is received)
Denial rate (following up on denied claims to maximize revenue generation)
Calculating these three key revenue cycle metrics can help you determine whether your revenue management cycle processes are efficient and effective, while also identifying improvement opportunities.
AAFP-recommended resource
The AMA STEPS Forward® Private Practice resources provide practical, step-by-step guidance to help physicians start, manage and sustain independent practices.
Find guidance on topics including:
- Business management
- EHR and software choices
- Marketing a practice
- Growing a practice
Days in accounts receivable
Days in accounts receivable (A/R) refers to the average number of days it takes a practice to collect payments due. The lower the number, the faster the practice is obtaining payment, on average.
How do you calculate days in A/R for a medical practice?
First, calculate the practice’s average daily charges:
Add all of the charges posted for a given period (e.g., three months, six months, 12 months).
Subtract all credits received from the total number of charges.
Divide the total charges, less credits received, by the total number of days in the selected period (e.g., 30 days, 90 days, 120 days, etc.).
Next, calculate the days in A/R by dividing the total receivables by the average daily charges.
Sample calculation of days in A/R

Best practice tip for days in A/R
Days in A/R should stay below 50 days at minimum; however, 30 to 40 days is preferable.
What are common revenue cycle challenges related to days in A/R?
Understanding your practice’s revenue cycle will help you anticipate income and address issues preventing timely payments. Keep the following in mind when evaluating your revenue cycle and A/R processes:
Slow-to-pay carriers. Some insurance carriers take longer to pay claims than the overall average number of days in A/R. For example, if your practice’s average days in A/R is 49.94, but Medicaid claims average 75 days, this should be addressed.
The impact of credits. Be sure to subtract the credits from receivables to avoid a false, overly positive impression of your practice.
Accounts in collection. Accounts sent to a collection agency are written off of the current receivables, and the revenue may not be accounted for in the calculation of days in A/R. Be sure to calculate days in A/R with and without the inclusion of collection revenue.
Appropriate treatment of payment plans. Payment plans that extend the time patients have to pay accounts can result in an increase in days in A/R. Consider creating a separate account that includes all patients on payment plans and determine whether your practice should or should not include this “payer” in the calculation of days in A/R.
Claims that have aged past 90 or 120 days. Good overall days in A/R can also mask elevated amounts in older receivables, and therefore, it is important to use the “A/R greater than 120 days” benchmark.
Adjusted collection rate
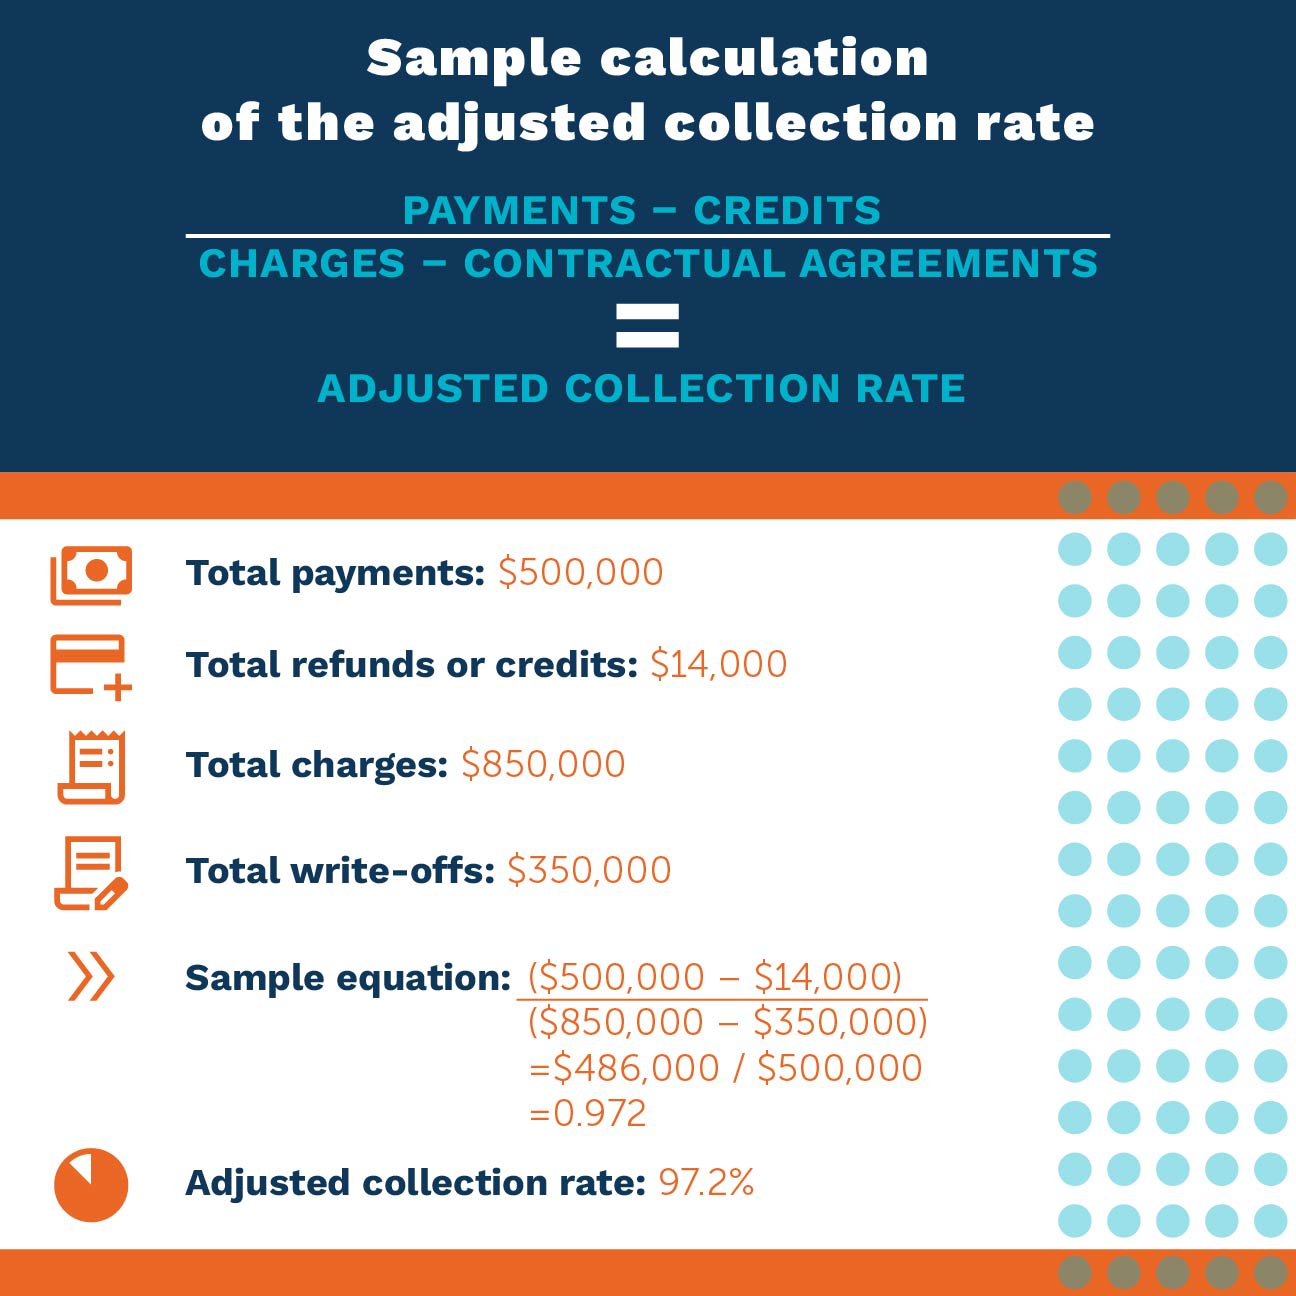
The adjusted collection rate represents the percentage of reimbursement collected from the total amount allowed based on contractual agreements and other payments—i.e., what you collected versus what you could have or should have collected. This metric shows how much revenue is lost due to factors in the revenue cycle such as uncollectible bad debt, untimely filing and other noncontractual adjustments.
Key metric: Adjusted collection rate
This video explains balancing collections, how to calculate the adjusted collection rate and common problems associated with the adjusted collection rate.
How do you calculate the adjusted collection rate for a medical practice?
To calculate the adjusted collection rate, divide payments (net of credits) by charges (net of approved contractual agreements) for the selected time frame and multiply by 100.
Best practice tips for the adjusted collection rate
The adjusted collection rate should be 95%, at minimum; the average collection rate is 95% to 99%. The highest performers achieve a minimum of 99%.
Use a 12-month time frame when calculating the adjusted collection rate.
Keep fee schedules and reimbursement schedules on hand to get an accurate picture of what you should have been paid and avoid inappropriate write-offs.
What are common revenue cycle challenges related to the adjusted collection rate?
Inappropriate write-offs
One of the most common mistakes when posting payments is applying inappropriate adjustments to charges.
For example, failing to distinguish between noncontractual adjustments and contractual adjustments results in a misleading view of how well your practice collects the money it has earned.
Categorizing noncontractual adjustments (e.g., “untimely claims filing” or “failure to obtain prior authorizations”) will help reveal sources of errors and identify opportunities to improve revenue cycle performance.
Denial rate
The denial rate represents the percentage of claims denied by payers during a given period. This metric quantifies the effectiveness of your revenue cycle management processes. A low denial rate indicates cash flow is healthy, and fewer staff members are needed to maintain that cash flow.
Key metric: Denial rate
This video explains the importance of the denial rate, how to calculate the denial rate and how to avoid common mistakes associated with the denial rate.
How do you calculate the denial rate for a medical practice?
To calculate your practice’s denial rate, add the total dollar amount of claims denied by payers within a given period and divide by the total dollar amount of claims submitted within the given period.

Best practice tips for the denial rate
A 5% to 10% denial rate is the industry average; keeping the denial rate below 5% is more desirable.
Automated processes can help ensure your practice has lower denial rates and healthy cash flow.
What are common revenue cycle challenges related to the adjusted collection rate?
Failure to identify mistakes prior to claim submission
Mistakes made during coding and charge entry can result in claims that are adjudicated and rejected by a payer. Establishing an internal process to identify and correct any mistakes prior to claim submission will decrease denial rates and produce a healthier cash flow.