Its ease of use and flexibility make it a helpful tool for managing information from the most mundane to the most complex.
Fam Pract Manag. 1999;6(5):51-52
Every day, we physicians are bombarded with information that we need to organize, and a spreadsheet can be one of your best organizational tools. With a few keystrokes, a spreadsheet can help you create a balance sheet for your practice, analyze the data from a clinical study or calculate your future net worth.
Several good spreadsheet packages are available, but one of the most popular, and one that may have come with your computer, is Microsoft Excel. Although it's quite powerful, you don't have to be an Excel whiz to use it profitably. Here are some tips to help you get started.
Some basics
When you open Excel, you see a grid with lettered columns and numbered rows. Into the cells of the spreadsheet you can enter data in the form of numerals, text or (most important) formulas, which perform calculations with data in other cells.
Near the lower left corner of the screen, you'll see file folder tabs. Each tab represents a spreadsheet within a larger “workbook.” (Excel lets you perform calculations involving data in multiple spreadsheets within a workbook.)
Formulas and functions
One of the best aspects of Excel is that the program makes using formulas very easy. Literally hundreds of formulas, from simple sums and averages to complex statistical calculations, can be entered by clicking on the Function Wizard button (fx) on the standard toolbar. Excel groups its functions into categories, including financial, statistical, logical and “most recently used” functions.

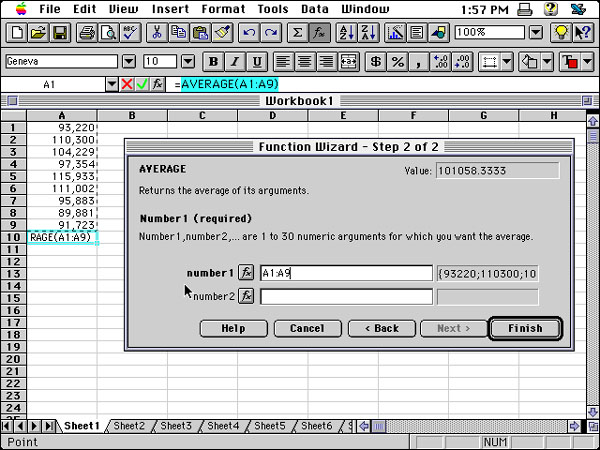
To learn how to use functions, let's find the average of the values in a series of cells using Excel 5.0, a fairly common version of the program. First, enter values in cells A1 (the intersection of column A and row 1) through A9. (To enter a number into a cell, click once on the cell and type the number. Then either press Return or click on the next cell.) Click on an empty cell in which you'd like to display the average (let's say A10). Then click on the Function Wizard button to display Excel's functions. The wizard will show you two lists: a list of function categories in the left-hand window and a list of functions in the current category in the right-hand window. Click on Statistical in the list of categories to show the statistical functions available. Then click on AVERAGE in the function list and click the Next button. The wizard screen for the Average function appears (see the figure). With the wizard, you could enter a series of numbers in the lines provided, and the wizard would calculate their average. In this case, you already have the numbers on the spreadsheet, so you need only to tell Excel which cells you want included in the Average function by clicking on cell A1 and holding down the mouse button while dragging the mouse over all the others through A9. The range automatically appears on the wizard screen and in the cell you highlighted. Click on Finish, and the average appears in cell A10. The beauty of a spreadsheet is that as you change the value in any cell included in a formula, the result will change accordingly. Try it!
As you become more proficient with Excel, you can move up the difficulty scale by combining different functions in your formulas. The complexity of an Excel formula is limited only by your imagination and patience.
Sorting
Another very useful Excel feature is its ability to sort data. Excel allows you to sort by up to three criteria at once, according to the priorities you set (e.g., sort the rows first by column B, then by column A, then by column E). For example, if you had a list of your patients that included columns for name, gender and age, Excel could help you reorganize the list based on any or all of those criteria.
Graphing
Excel helps you present your data as well as manipulate them. The program's Chart Wizard takes you step by step through the process of creating a chart. It lets you choose from 15 different chart types (each with several different versions) and helps you label the data and the chart itself.
Whether you're creating a simple patient phone directory or tracking data for a disease management program, you'll find that Excel will rise to the challenge. But it's also user-friendly enough to keep beginners from getting lost or overwhelmed.