
Where else can you get EHR advice from a few thousand colleagues?
Fam Pract Manag. 2012;19(6):23-30
Dr. Adler is a practicing family physician, medical director of information technology for Arizona Community Physicians in Tucson, Ariz., a Certified Professional in Healthcare Information and Management Systems, a juror for the Certification Commission for Health Information Technology, and an independent consultant in health care information technology. He holds a Master of Medical Management degree and a Certificate in Healthcare Information Technology, and he serves on the Family Practice Management Editorial Advisory Board. Author disclosure: no relevant financial affiliations disclosed.

Perhaps it's the Medicare and Medicaid incentives, or perhaps it's just that the time has come. Regardless, physicians seem to be computerizing their records in larger numbers than ever before, making this an opportune time to release the results of the latest Family Practice Management (FPM) survey of user satisfaction with electronic health records (EHRs). If you are in the market for an EHR, we hope you will find this report useful.
As with our four earlier surveys,1–4 we published the survey instrument in an issue of FPM and made an online version available through the FPM website.5 Again this year, in an effort to maximize responses, we kept the survey short and offered incentives for usable responses (one Apple iPad and 10 one-year subscriptions to FPM, which were awarded to randomly selected respondents). We also followed up publication of the survey with reminders in FPM email newsletters and sent one email reminder to most active members of the AAFP. Given the wide availability of the survey instrument, we accepted responses only from AAFP members as a way of avoiding frivolous responses, multiple responses per individual, and other such potential sources of bias.
As with previous surveys in this series, our aim was not to provide a statistically accurate picture of EHR use among AAFP members; rather, we simply wished to collect opinions from as many users of as many EHR systems as possible and to convey the range of responses as clearly as we could in an easily digestible form.
Survey results
We were able to collect a total of 3,397 responses. Of those, we excluded 303 because the respondents either said they did not use EHR systems or didn't name identifiable systems. We excluded six more because the respondents indicated that they had a significant financial interest in or affiliation with a manufacturer or vendor of an EHR program (e.g., an ownership interest, a sizable stock purchase, or involvement in development of the software). That left 3,088 responses for analysis.
Respondents in the analysis group reported a total of 160 identifiable EHR systems, 129 of which were used by 12 or fewer respondents. (Compare these numbers with those from our 2011 survey.1 Then, 12 percent fewer respondents, 2,719, reported 28 percent more systems, 205. The difference may indicate a continuing consolidation of the EHR market.) The 31 systems reported this year by 13 or more respondents accounted for 92 percent of responses (2,830). These 31 systems are the ones we will provide system-specific results for, using the average of all 3,088 responses as a point of comparison. We chose to focus on these 31 systems because we believed that the number of responses was sufficient to represent a reasonable spread of opinions on each system. These are the 31 systems in question, with the number of respondents reporting each system given in parentheses:
| AHLTA (N = 69) | eMDs (N = 130) | PowerChart/PowerWorks (N = 136) |
| Allscripts Enterprise (N = 189) | EpicCare Ambulatory (N = 509) | Practice Complete (N = 13) |
| Allscripts MyWay (N = 19) | HealthConnect* (N = 28) | Practice Fusion (N = 47) |
| Allscripts Professional (N = 177) | Horizon Ambulatory Care (N = 26) | Practice Partner (N = 104) |
| Amazing Charts (N = 102) | InteGreat EHR (N = 15) | Praxis (N = 21) |
| Aprima (N = 19) | Intergy EHR (N = 48) | PrimeSuite (N = 50) |
| athenaClinicals (N = 63) | MEDENT (N = 49) | RPMS (N = 14) |
| Care360 EHR (N = 13) | MPM (N = 40) | SOAPware (N = 53) |
| Centricity EMR (N = 181) | NextGen Ambulatory (N = 294) | SuccessEHS (N = 19) |
| Centricity Practice Solution (N = 65) | Point and Click EHR (N = 14) | VistA CPRS (N = 20) |
| eClinicalWorks (N = 303) | ||
| *HealthConnect is Kaiser Permanente's version of EpicCare. | ||
A more detailed list that includes the vendor name and web address for each system is available in a
. Three of the 31 systems are government-developed EHRs. AHLTA is the Defense Department's EHR, RPMS is the Indian Health Service's system, and VistA CPRS is the Veterans Administration system. HealthConnect is a system used by Kaiser Permanente. Point and Click EHR is used by college health services. We have included these systems for comparison.
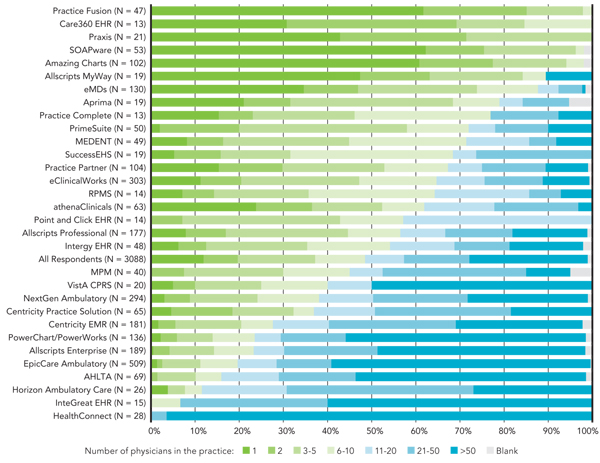
About half of respondents came from practices with 10 or fewer physicians (49 percent, or 1,498), and almost as many (42 percent, or 1,285) came from practices of more than 20 physicians, with 828 of those (27 percent of the total) coming from groups of more than 50 physicians. As we expected, certain EHR systems were reported more commonly in small practices and others more commonly in large ones. The practice-size distribution of the 31 systems is shown below. At least 67 percent of users reporting the first 13 systems shown in the chart (from Practice Fusion through Practice Partner) come from practices of one to 10 physicians, while at least 67 percent of users reporting the last seven systems (from PowerChart/PowerWorks through HealthConnect) come from practices of more than 20 physicians.
The majority of respondents (57 percent, or 1,769) said they had up to three years of experience with the system they reported on. Another 38 percent (1,166) reported more than three years but less than 10 years of experience. Asked to estimate their skill in using their EHR systems, a large majority of respondents said they considered themselves average or above average but not expert users of their EHR systems (75 percent, or 2,320), while 17 percent (524) considered themselves experts, and only 4 percent (113) considered themselves novice users. The percentage of respondents who reported having switched EHR systems at least once because of unhappiness with a prior system remained at about the same level as in the 2011 survey (15 percent, or 471).
Dimensions of satisfaction
To determine users' satisfaction with various aspects of their EHR systems, we asked respondents to indicate their level of agreement or disagreement with each of the following 19 statements, using the scale Strongly Agree, Agree, Neutral, Disagree, Strongly Disagree, and Unsure:
I can document care easily and efficiently with this EHR.
I can find the information I need easily and efficiently with this EHR.
This EHR clearly displays the information I need without unnecessary information or other clutter.
This EHR helps me avoid making mistakes.
Using this EHR, I can create notes that promote better patient care; for instance, other physicians would find that the notes provide all the information they need in an easy-to-digest format.
This EHR allows me to complete tasks efficiently, without seemingly unnecessary steps.
This EHR helps me focus on patient care rather than on the computer.
This EHR presents alerts that are concise, appropriate, and helpful.
This EHR provides useful tools for disease management (for instance, diagnosis-specific prompts, alerts, and patient education materials).
This EHR provides useful tools for preventive medicine (for instance, flow sheets, alerts, and patient education materials).
This EHR makes it easy to qualify for meaningful use incentive dollars from Medicare or Medicaid.
This EHR doesn't just enable me to meet meaningful use criteria; it actually helps me provide better patient care.
E-prescribing is fast, easy, and error-free with this EHR.
Intra-office messaging and tasking are fast, easy, and effective with this EHR.
Learning to use this EHR is easy.
Our EHR vendor provides excellent support (for instance, fixing bugs quickly, offering useful training, and providing timely upgrades that go well).
This EHR helps me see more patients per day (or go home earlier) than I could with paper charts.
I enjoy using this EHR.
I am highly satisfied with this EHR.
Preliminary ranking
For a rough, preliminary sense of the survey results, we ranked the 31 systems by the percentage of respondents who indicated that they agreed or strongly agreed with each of the statements. The results are shown in “Survey overview: 31 EHR systems ranked on 19 dimensions.” To help make sense of the array of numbers, the highest five rankings for each statement are tinted green and the lowest five are tinted orange. The systems are listed by the sum of their ranks.
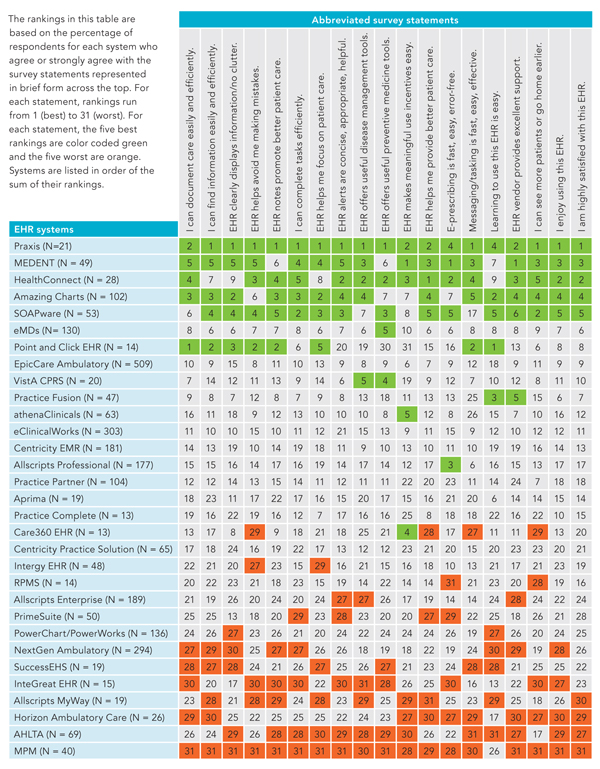
This ranking, although crude in that it weights all 19 dimensions equally, offers some useful insights. As you'll see, the high and low rankings tend to cluster in certain systems. As in past surveys, the systems most commonly reported by physicians in small practices tend to appear toward the top of the rankings, while those most commonly reported in large practices tend to appear toward the bottom of the rankings. We have reason to believe that practice size is independently related to satisfaction,6 so this may not be due entirely to the qualities of the EHR systems themselves. Given that clustering, though, it may be useful to note that three systems commonly reported in small practices – Allscripts MyWay, PrimeSuite, and SuccessEHS – are ranked toward the bottom, while two systems commonly reported in large practices – HealthConnect and EpicCare Ambulatory – show up near the top of the rankings. In our 2011 survey, Allscripts MyWay ranked similarly low and EpicCare Ambulatory ranked similarly high; PrimeSuite fell toward the middle of the rankings, and neither HealthConnect nor SuccessEHS was reported by enough respondents to make the system-specific results.
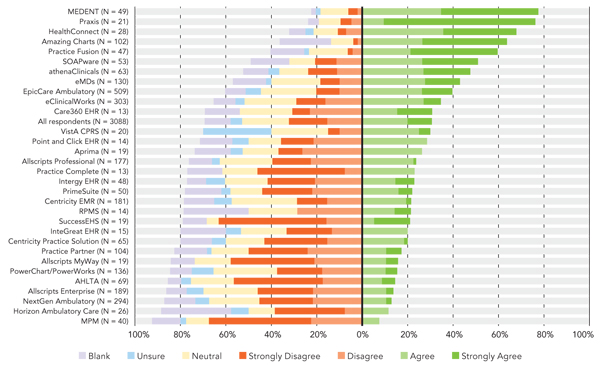
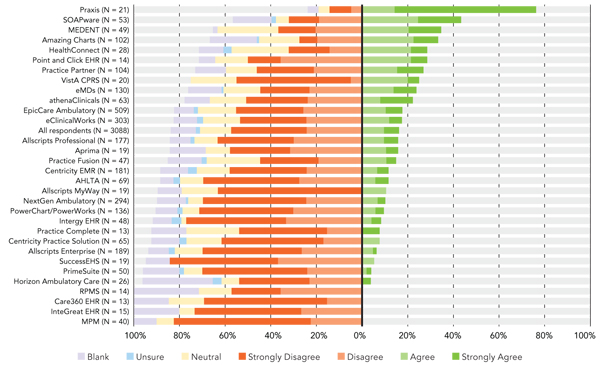
Response spectrum charts
To better visualize the full range of responses to each statement, we rely on charts such as “Response spectrum: ‘Learning to use this EHR is easy.’” Each bar in a response spectrum chart represents 100 percent of responses for a given system (or for all systems reported, in the case of the “All respondents” bar), so all bars on the chart have the same overall length. The bars are divided into sections representing, from left to right, Blank (respondents who left the item blank, if any), Unsure, Neutral, Strongly Disagree, Disagree, Agree, and Strongly Agree. Bar segments for Blank, Unsure, and Neutral are positioned to the left and given only light tints to help highlight the segments representing active agreement or disagreement. Keep in mind, however, that the Blank, Unsure, and Neutral segments do not represent negative responses and could as easily have been placed on the far right end of the bars. The bars are positioned so the dividing line between agreement and disagreement falls on a midline, so bars that fall mostly to the right of the midline represent a predominance of agreement with the statement, while those that fall mostly to the left indicate a predominance of disagreement. Bars are ordered by the sum of Agree and Strongly Agree responses so that the systems with the most positive responses appear toward the top of the chart. To interpret the chart, though, you need to look at individual bar segments, not just the order of the bars. For instance, while Aprima shows up as the sixth bar in the chart, it received a much lower percentage of Strongly Agree responses (5 percent) than either SOAPware or MEDENT, immediately above and below it (21 percent and 22 percent, respectively), suggesting a somewhat weaker intensity of agreement. It also helps to note the position of the “All Respondents” bar in each chart, since you can think of systems appearing above that bar as receiving above-average responses and those below that bar as receiving below-average responses.
While we have room here to display only a few response spectrum charts, the
does provide all 19. The appendix also includes a summary chart, which sums responses to all 19 items, and charts of results for other questions asked on the survey. The charts we've selected to include here display results for four qualities that seem particularly likely to be important to anyone selecting a system:
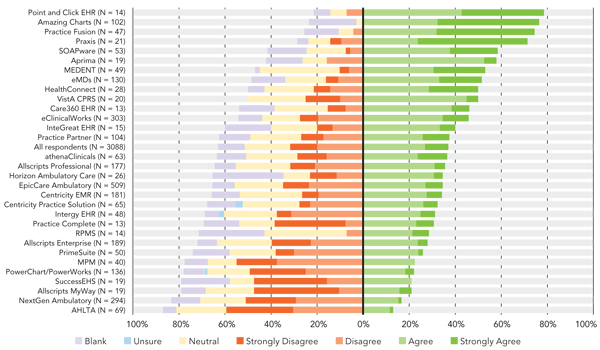
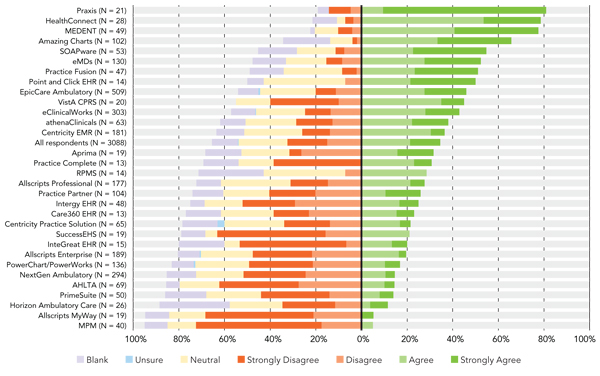
The same systems tend to show up at or near the top and at or near the bottom of all four charts, as you'd expect from the ranking table, but the charts show more, as we suggested above. For instance, the productivity chart above, shows a general preponderance of negative responses, with four systems at the bottom having no positive responses at all and only Praxis, at the top, showing a substantial degree of agreement. Overall, in fact, 57 percent of respondents disagree that their EHR helps them see more patients or go home earlier (33 percent of them disagree strongly), presumably finding that the claim that EHRs increase productivity doesn't hold true for them.
Some overall observations
Looking at data from all 3,088 responses is instructive. The aspects of EHRs that users are most satisfied with are the way they facilitate intra-office messaging and tasking, finding information, documenting, and e-prescribing (60 percent, 58 percent, 57 percent, and 56 percent positive responses, respectively; see the Agree and Strongly Agree responses in individual response spectrum charts in the
). The areas of lowest satisfaction are EHRs' effects on productivity, their effects on the physician's ability to focus on patient care, and vendor support (only 16 percent, 24 percent, and 36 percent positive responses, respectively). Finally, only 38 percent of users agree or strongly agree that they are highly satisfied with the systems they use. It appears that there is a lot of room for improvement in the EHR product world – this despite the fact that 37 percent of respondents (1,131) agree or strongly agree with the statement, “I enjoy using this EHR.”
CMS certification for EHR incentives
Of the 31 products, the only ones not certified by the Centers for Medicare & Medicaid Services (CMS) as complete EHR products capable of “meaningful use” for the purpose of receiving CMS incentive payments are systems developed for special situations – the military (AHLTA), Kaiser Permanente (HealthConnect), college health services (Point and Click EHR), and the Veterans Administration (VistA CPRS).
Caveats
As in past surveys, our goal was not to pick clear “winners” in terms of user satisfaction. The system characteristics covered in the survey may have different weights for different practices. Practice size especially seems to be an important enough consideration that it would make no sense to say that Praxis or Amazing Charts is “better than,” say, InteGreat, EpicCare, or any other system reported mostly or entirely by respondents in large groups.
In addition, this survey shares several limitations with earlier surveys. That respondents were self-selected may mean that the survey attracted EHR enthusiasts, or at least physicians with particularly strong feelings about their EHRs, positive or negative. Moreover, cell size is a problem in two ways. By considering only systems for which we had 13 or more respondents, we necessarily omitted numerous systems; on the other hand, by including systems for which we had as few as 13 respondents, we risked additional bias. Another limitation is that we did not report separately on different versions of the same product. This was due largely to the fact that many users do not know their EHR's version number. It's probably best to consider the survey results as input you would get from a large number of colleagues who volunteered informally to report on their EHR experience. That said, we believe that the results presented in this article and its online appendix can help any family medicine practice considering the purchase of an EHR system. We hope you find them useful.
