Do you have the right number of patients on your panel? Here's a process and a spreadsheet for calculating and adjusting your panel based on actual patient behavior.

A foundational principle of family medicine is continuity of care — a personal, therapeutic relationship with your patients over time. Continuity matters because it results in lower costs, higher patient satisfaction, and enhanced clinical care and outcomes.1–3
Continuity depends on a clearly defined, right-sized patient panel. A right-sized panel allows the physician and associated care team to work to full capacity while meeting the panel's needs in terms of access, quality of care, and patient experience.2–4 A wrong-sized panel results in problems with continuity, quality, access, patient satisfaction, and physician burnout.4–5
This article explains how to achieve a right-sized patient panel starting with a proven method of panel attribution and then applying a practical method to adjust raw panel numbers for patient acuity and workload complexity based on actual patient behavior (see "How to right-size your panel"). Using the spreadsheet introduced in this article, physicians can objectively illustrate their workload and lay the foundation for discussion with their employer about right-sizing their patient panel.
KEY POINTS
- A patient panel that is too large will result in problems related to continuity, quality, access, patient satisfaction, and physician burnout.
- Increased patient acuity and increased amounts of nonvisit work are making panel sizes unmanageable for many physicians.
- Patient panels must be accurately attributed and right-sized, with adjustments for acuity and workload complexity.
- The spreadsheet model outlined in this article offers a tool for right-sizing your patient panel and demonstrating to employers why non-visit work should be included in the equation.
HOW TO RIGHT-SIZE YOUR PANEL
- Use the four-cut method to identify and attribute patients to each physician or other provider within a like category in the practice (e.g., primary care or a set of clinicians with a similar scope of practice who could provide coverage for one another).
- Complete the panel spreadsheet, which captures current panel and visit rate on the demand side and days worked and visits per day on the capacity side.
- Decide how you will measure nonvisit work (using weighted discrete events or EHR log-in time, for example) and adjust capacity (clinician visits per day) accordingly. This may require discussion within the organization.
- Derive the right-sized panel by dividing clinician visit capacity by the panel visit rate.
- Compare the current active panel and the right-sized panel to see whether you are over- or under-paneled.
- Identify opportunities to balance the panel equation by closing or opening to new patients, influencing the visit rate or length through greater efficiency, enhancing physician capacity through team support, or other strategies.6–7
WHAT HAS CHANGED ABOUT PATIENT PANELS?
Since the last two panel articles were published in FPM in 2007,6–7 we have seen a reemergence of interest in the topic. However, the focus has shifted from estimating panel size (i.e., the specific set of patients for which a physician is responsible) to adjusting panel size for patient acuity and workload complexity.
Just a few years ago, only a third of family physicians could estimate their panel size.8 Now, perhaps because more physicians are employed, panels tend to be more clearly defined. Organizations often set a target panel size and expect physicians to manage their defined set of patients. This includes not only direct patient care (i.e., visits, whether face-to-face or through another modality) but also increasing amounts of indirect patient care (i.e., nonvisit responsibilities such as documentation, lab review, refill management, asynchronous communication with patients, chronic care management, and compliance with preventive care recommendations).9–12 However, physicians often have little control over the assigned panel size, and most organizations make only token efforts to right-size the panel for acuity and complexity or to monitor the resulting nonvisit workload. The organization simply relies on physician integrity and professionalism to complete the work, much of it occurring after hours.
Due to advances in sophistication of the electronic health record (EHR), more data and information is now available. While this has set the stage for improved care, particularly in the areas of prevention, chronic disease, and population health, it has also led payer groups and regulatory bodies to set new reporting requirements and payment incentives. In turn, organizations have become focused on measurement and compliance. All of these actions have increased physicians' workload and time commitments.
Introduction of portals for patient-physician interaction, telehealth advances for direct care by phone or video, mechanisms for medication reconciliation, refills, and lab review, and other technology solutions have made the work in health care more immediate. While these solutions may be more satisfying to patients, they have also increased the pressure for timely responses and increased physicians' asynchronous nonvisit care workload.
Increased EHR and nonvisit care tasks, coupled with physicians' perceptions of their ability to provide high-quality care in this context, are frequently cited as causes for physician burnout and disengagement.9 Concerns about increased workload have led physicians to push back against unmanageable panel sizes and ask employers to adjust their panels for patient acuity and workload complexity in order to achieve equity, fairness, and balance.3
THE FOUR-CUT METHOD FOR PATIENT ATTRIBUTION
Patient panels have to be both accurately attributed and right-sized.4,13 In this first step (attribution), each patient must be assigned to only one primary care physician or advanced practice provider (i.e., one clinician in a like category). Accepting the current EHR “provider” field as panel designation is fraught with error, as many patients have no provider, an incorrect one, or perhaps a specialist listed.4
The four-cut method starts by identifying unique, unduplicated patients seen in the last 12 months by any primary care physician or advanced practice provider in the practice. We recommend the 12-month time period because we believe it most clearly identifies the active workload. (See “Panel look-back periods” for more explanation.)
PANEL LOOK-BACK PERIODS
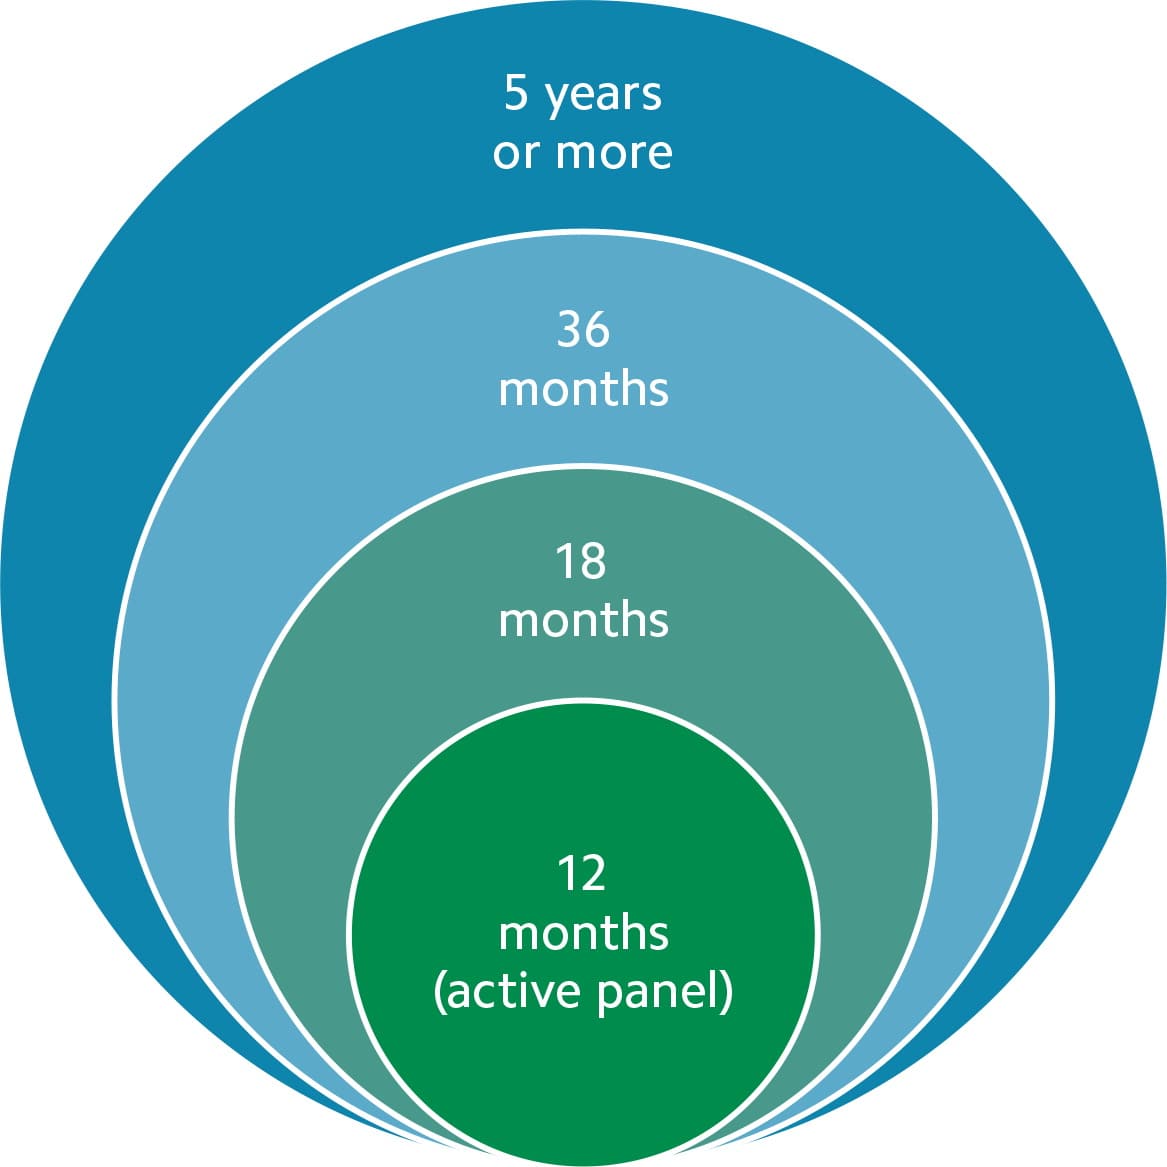
Patient panels can be seen as a set of ever-widening concentric circles. The center circle contains the active panel: the unique, unduplicated patients seen over the last 12 months by each physician. As the circle widens, the timeframe expands to 18 months, 36 months, or five years or more. Each circle has a different utility. Wider circles can be used to identify and close care gaps or to appoint patients who have not been seen recently but return to the practice. Many payers use the 36-month circle to define the billing line between established and new patients.
The center circle, set at 12 months, most clearly identifies the active workload. A circle wider than 12 months captures far too many deceased patients or patients who have recently left the practice due to geographical moves or changes in insurance status.
Because many patients in a practice may have seen multiple physicians or other providers, the four-cut method then attributes patients to the proper clinician by applying these criteria:
- Which patients saw one clinician exclusively? Assign them to that clinician.
- Which patients saw one clinician predominantly? Assign them to that clinician.
- If patients saw more than one clinician the same number of times, who saw that patient first, last, or for any sort of bonding exam, such as a physical examination? Any one of these criteria can be used in this cut.
- For any remaining patients, ask the clinicians to confirm together (or ask the patients) who the “primary provider” should be.
The EHR provider field needs to be updated to reflect these discoveries.
THE RIGHT-SIZING PROCESS
While attribution reveals the size of the current panel, right-sizing shows what it should be. Once you complete the four-cut method for patient attribution described above, you can then use the panel-size spreadsheet to compare your current panel to the right-sized panel.
The right-sized panel balances patient demand with clinician capacity to manage that demand, and it is derived from a formula: right-sized panel = (days worked per year × visits per day)/visit rate.
The right-sized panel number is unique to each clinician. It is based on patient behaviors that reflect acuity, clinician style, and workload and derived from the actual, individual panel-patient visit rate, days worked, and visits per day.
Calculating demand. In the spreadsheet, enter your current active panel from the four-cut method (column A) and panel patient visits over the last 12 months (column B), which will yield your panel visit rate (column C). For example, if your current active panel per the four-cut method is 1,500 patients and you delivered 3,750 panel patient visits over the last 12 months, then the visit rate would be 2.5 visits per patient per year.
Calculating capacity. In the spreadsheet, enter your days worked per year (column D) and visits per day (column E), which will produce the visit capacity (column H). For example, if you work 220 days per year and provide 24 visits per day, your visit capacity is 5,280 visits per year.
However, that capacity number may be inflated if your organization does not take into account nonvisit work. In the past, nonvisit work could often be folded into visit length, but the requirements of the EHR and other administrative tasks have made this challenging. Nonvisit work often extends outside of visit time. To account for nonvisit work, you will need to identify the standard work day in your organization and the time you spend on visit versus nonvisit work. Nonvisit work can be measured using EHR login time, weighted discrete events, or other methods.13 For example, if eight hours is the standard work day and you spend two hours per day for nonvisit work (column G), that means you now have only 6 hours per day for visit work (column F). You would then need to reduce your visits per day (column E) proportionally — by 25 percent in the example. Employers may need convincing to include nonvisit work hours in the capacity equation, but the spreadsheet can help demonstrate the problem of ignoring nonvisit work and spark discussion.
Results. In the “results” section of the spreadsheet, you will see the right-sized panel (column I), which is the visit capacity divided by the panel visit rate. For example, if you have the capacity to provide 5,280 visits per year and your panel visit rate is 2.5 visits per patient per year, then your right-sized panel is 2,112 patients — or 1,584 patients if you have accounted for nonvisit work as described above.
The spreadsheet then compares the current active panel (column A) to the right-sized panel (column I) to show if you are over- or under-paneled (column J). You can begin addressing both issues by opening or closing your panel to new patients,6–7,13 and this spreadsheet can help you make that case to your employer and identify additional interventions to right-size your panel.
The spreadsheet should be recalculated monthly to capture a rolling 12-month period that reflects patients moving in or out of the panel and any other changes in demand or capacity.
RIGHT-SIZED PANEL CALCULATOR
The panel-size spreadsheet shown here is available for download. It illustrates how different variables can affect a physician's right-sized panel (column I).
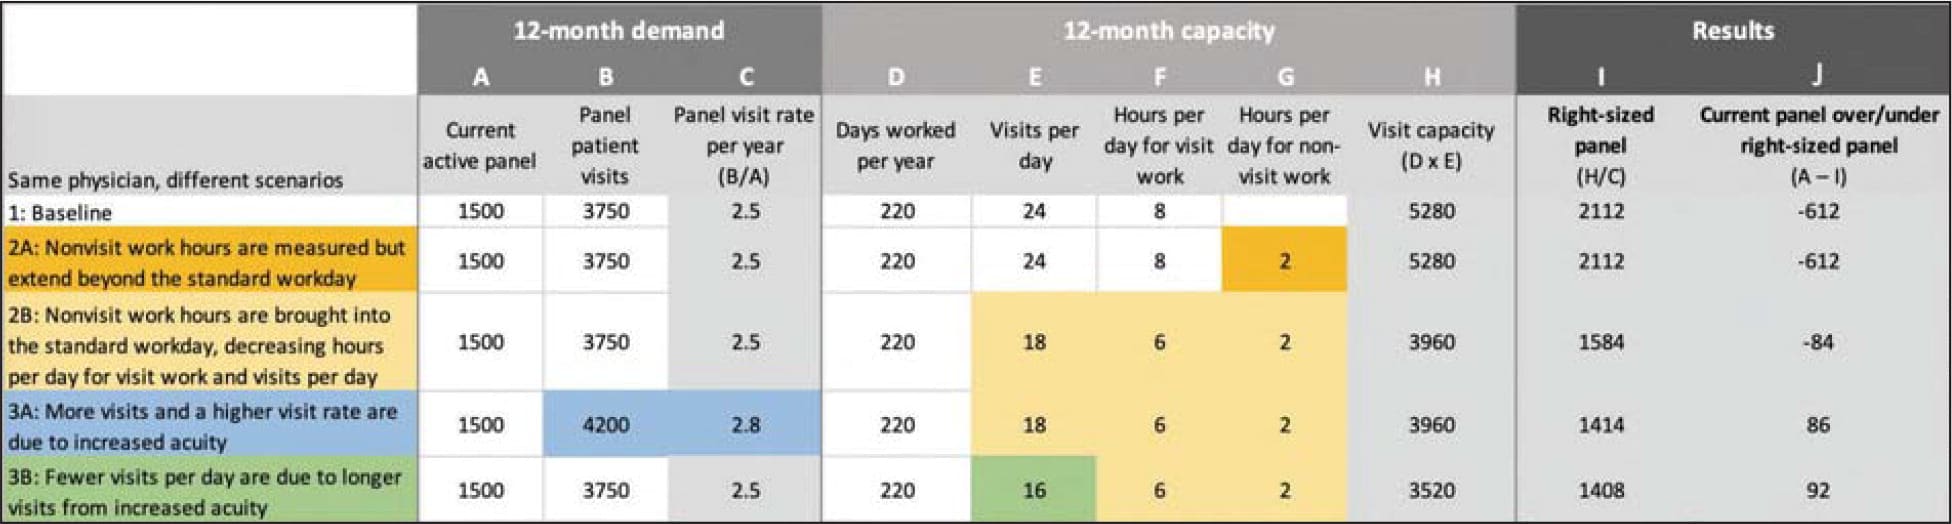
Scenario 1 is the typical starting point, where nonvisit work (column G) is ignored in the panel size equation.
Scenario 2A captures the hours per day for nonvisit work (two hours in this example) but still does not factor it into the panel size equation. Because nonvisit work is allowed to extend past the standard work day, this scenario does not lead to a fully right-sized panel.
Scenario 2B demonstrates the impact of folding all the nonvisit work time back into the standard work day, reducing time available for visits (column F) and ultimately visits per day (column E). Physicians should work with their organization, using this data-driven approach, to determine the acceptable way to do this and its effects. In this example, the right-sized panel decreases from 2,112 patients (without considering nonvisit work) to 1,584 patients (with nonvisit work considered). Given the current active panel of 1,500 patients (column A), the physician would have room to accept only 84 more patients.
Scenario 3A demonstrates how increased acuity shows up in panel behavior as more visits. This increases the panel visit rate per year, which decreases the right-sized panel from 1,584 patients to 1,414 patients in this example. The physician would be over-paneled by 86 patients with this increase in acuity.
Scenario 3B demonstrates how increased acuity shows up in panel behavior as longer visits, meaning fewer visits can be offered per day, which decreases the right-sized panel from 1,584 to 1,408. The physician would be over-paneled by 92 patients.
A PRACTICAL APPROACH TO PANEL ADJUSTMENT
The desire for panel adjustment relates to both patient visit acuity and nonvisit workload complexity. Acuity and complexity are euphemisms for more work. If the sum of visit and nonvisit workload is intolerable, the conclusion is that the panel is too large and requires adjustment.4,13–18
Although there is general agreement that panels do need to be adjusted for acuity and workload complexity, how to adjust them is the subject of much debate. We have shown above how the spreadsheet offers a way to manually adjust for nonvisit work. Below we will discuss how the spreadsheet automatically adjusts for acuity.
Common approaches to panel adjustment. Most previous attempts at panel adjustment have been difficult to apply and have not delivered what they have promised. They typically involve applying external variables to artificially weight the panel. The adjustments are based on patient characteristics such as age, gender, comorbidities, medication utilization history, social determinants of health (SDOH), payer group, or language preference.19–26 To try to account for these variables, practices apply weighted or multiplier factors to the current raw panel number for each risk parameter.
Another common approach is to use system costs or specific established diagnoses to attempt to adjust patient panels. The Centers for Medicare & Medicaid Services (CMS) does this through its hierarchical condition category (HCC) codes for Medicare. However, because primary care patients will often present and return multiple times without a definite diagnosis, diagnosis-based models do not effectively capture the workload.13 Other common adjustment methods involve assigning patients a risk score, often based on inpatient acuity, or using commercial or proprietary risk-adjustment products or built-in EHR products.13
These methods to adjust panels have not resulted in clarity, precision, acceptance, manageable workload, or fairness. No one single risk factor can capture all risk. The more factors an organization uses, the more the weighted risk from one factor either cancels out or amplifies the weighted risk from another. Most of these factors reflect only visit, inpatient, or cost components of risk and do not directly capture outpatient or nonvisit components, such as the nonvisit work required to manage chronic disease. In addition, they do not take into account individual physician style, skill set, practice support, and staffing, all of which influence how the demand burden is actually managed.
A practical approach to panel adjustment using the spreadsheet. Use of the monthly updated spreadsheet based on recent retrospective actual patient behavior and activity far more accurately assesses and captures patient acuity and workload complexity than external predictive models. The spreadsheet uses each clinician's actual patient behavior, whereas external factors use distant retrospective behavior of large populations and generalize to each clinician.
Patient acuity is inherent in the numbers captured on each side of the demand-capacity equation in the spreadsheet. Greater acuity shows up as more work, which may be captured as more visits and a higher visit rate on the demand side or longer visits, more time spent on nonvisit work, and fewer visits offered per day on the capacity side. These numbers then automatically adjust the current panel to arrive at the right-sized panel. In fact, the spreadsheet captures not only the acuity variables for patients (e.g., age, gender, diagnosis, SDOH) but also system variables (e.g., amount of support, team-based care model) and physician variables (e.g., style and pace choice) because it is based on actual behaviors.
As the spreadsheet is recalculated each month, it captures changes in patient behaviors due to both clinical and nonclinical factors and adjusts the panel number. The spreadsheet serves as an indicator of over- or under-panel status and an immediate on-off button for accepting new patients. The right-sized panel ensures a manageable workload, equity, and fairness.
IN PURSUIT OF A MANAGEABLE WORKLOAD
Physicians want a fair panel size where the time required to care for their patients is manageable, given their capacity to complete the work. Accurate methods for panel attribution and adjustments for patient acuity factors and nonvisit complexity must be used. Panel adjustments that rely on external predictors of acuity and complexity and then generalize them to each physician's panel have not resulted in a universally accepted standard for adjustment. The spreadsheet model outlined in this article accounts for the significant patient, system, and clinician variables and results in an individualized, customized, balanced panel for each clinician based on actual patient behavior. Incorporating these elements into panel determination sets the stage for optimum continuity.