
HealthLandscape Introduces Population Health Profiler
May 29, 2018, 08:57 am Chris Crawford – HealthLandscape, an innovation the AAFP acquired in 2014, has released its new Community Vital Signs Population Health Profiler tool, which could be incredibly helpful for family physicians.
The Population Health Profiler lets users create detailed ZIP code tabulation area (ZCTA)-level maps of their service area and key community measures, including the distribution of age, ethnicity, social deprivation, inequities, access to health care and chronic conditions.
Users can also download a detailed report of 30 key measures in the areas of
- age and gender,
- race and ethnicity,
- inequities,
- social determinants of health, and
- chronic conditions and access to care.
"We created this tool to allow physicians the ability to easily upload a list of ZIP codes and counts of their patients in those ZIP codes to see the health and social characteristics of the areas that they serve," said Mark Carrozza, director of HealthLandscape.
"For example, you can map the percentage of the population with hypertension compared to your patient distribution, or you can map the percentage below poverty level or who have health insurance, all using small area estimates," he said.
HealthLandscape offers free webinars and a self-guided walkthrough for the Population Health Profiler.
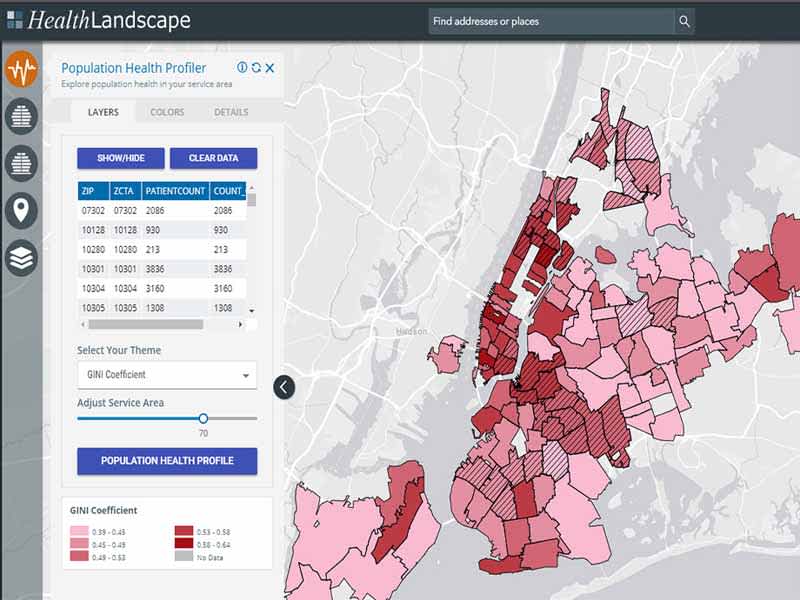
Using Population Health Profiler
Once users click on the Population Health Profiler icon at the top left of the screen, they can upload their ZIP codes and patient counts in .xls, .xlsx or .csv format from their patient management systems, select a community measure for their maps, adjust their core service area using a slider tool and create a report.
Initially, users' ZIP code data will be converted into ZCTA. Note that any ZCTA with fewer than 10 patients will not be shown. ZIP codes that do not have a direct ZCTA match will be collapsed into the ZCTA that best matches the ZIP code location.
Physicians can fully adjust the style and color of the map to best visualize their patient distribution for their needs, including adjusting what they consider their core service area.
"Using a 70-percent service area is typical for users looking at their core service area," Carrozza told AAFP News. "And not only can I map my patient count for this core area, I can map key measures the Social Deprivation Index, which was created by the Robert Graham Center."
A summary report is offered with detailed information for each ZCTA.
"For example, this Population Health Profile report says, 'Across all these ZCTAs that make up your core service area, there are a total of 330,000 people. Seventy-seven percent of them are 16 and older, 13 percent are 65 and older,' etc.'" Carrozza said.
One profile shows the percentage of races in each ZCTA, and a social determinants of health profile shows things such as percentages of unemployment, residents who don't own a vehicle and linguistic isolation.
The chronic conditions report shows percentages of the community's population, for example, that's diabetic, obese, hypertensive or uninsured.
Finally, a social inequality report includes key metrics such as income inequality, linguistic isolation and race differences in poverty, health insurance coverage and disability.
When the user is done, they can save the data into a PDF.
"Also, for people really interested in the data, they can download the raw data and use it for other purposes," Carrozza said.
Carrozza added that physicians could use the Population Health Profiler for work such as addressing a community's population health by reducing diabetes.
"Using a tool like this, physicians can figure out where the areas of highest need exist," he said. "Efforts including marketing and partnerships with community groups should be focused to these areas."
Community Vital Signs Application Suite
HealthLandscape intends the Community Vital Signs application suite to complement physical vital signs with information about where patients live.
"We are creating this suite of applications that range from applications strictly for computers talking to computers, to a public-facing, freely available site such as the Population Health Profiler, and to a clinical application embedded within firewalls that physicians' offices, hospital systems, health information exchanges and insurance companies can use to analyze the community context of their patients," Carrozza said.
Related AAFP News Coverage
2018 ACLF/NCCL
Pre-conference Workshop Aims to Advance Health Equity
(4/27/2018)
The EveryONE Project Unveils Team-based Resources
AAFP's Signature Health Equity Initiative Continues to Evolve
(4/6/2018)
Report Shows Health Disparities by County, Demographics
(3/27/2018)