Am Fam Physician. 2002;66(4):660-665
Children frequently are brought to emergency departments because of injury. Although the true incidence of intentional injury (child abuse) is unknown, estimates have been made that up to 10 percent of childhood injuries presenting to emergency departments are the result of abuse. Detection of abuse can be difficult in a busy emergency department. Benger and Pearce studied whether a simple, four-point checklist would increase awareness of child abuse and stimulate referral for further assessment.
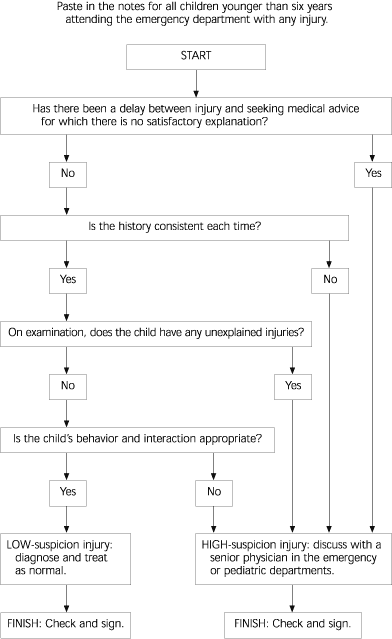
The study was conducted in a hospital serving a large English city. In a typical year, this emergency department treats 4,000 children five years or younger, and most cases are related to injury. In a preliminary audit, the investigators collected data from the charts of 1,000 consecutive children younger than six years who were treated for trauma. The flowchart (see accompanying figure) was developed from factors associated with child abuse in the literature and was designed as a sticker to be placed by the intake nurse in the chart of every injured child five years or younger who was examined in the department. The physician treating each patient was responsible for completing the flowchart.
Four weeks after introducing the flowchart, a second audit began of 1,000 consecutive injured children younger than six years. Each audit lasted about three months and occurred at approximately the same stage of training of two consecutive sets of house staff. These physicians had the same amount of training in child abuse. Senior medical staff and most nursing staff did not change during the study.
The second audit found that more than 70 percent of charts contained the flowchart, and the flowchart was completed in all but four cases. Child abuse was considered in the differential diagnosis in 711 of the 1,000 cases during the second audit, compared with 16 of the 1,000 cases in the first audit. Other significant differences included improved documentation of the child's general condition, search for additional injuries, questions about delay of presentation for treatment, and measures to verify consistency and compatibility of injuries. Referral for another opinion and checking the child protection register were more common in the second audit, but the differences did not reach statistical significance.

The authors conclude that the addition of the flowchart increased awareness of and vigilance for child abuse, with measurable, significant changes in house staff documentation practices. They wish to extend use of the system to other potential victims of abuse and to make the flowchart a required part of the automatically generated chart for all patients.
editor's note: Chart reminder and prompting systems seem to work well for several conditions, such as screening and immunization, provided that the condition is perceived to be important by the staff responsible for completing the documentation, the system is easy and takes little time, and the process results in action. The key seems to be leadership, especially in giving feedback to all members of the team that high compliance with the task is appreciated and actually contributes to the quality of care. Otherwise, it becomes one more poorly completed and rarely used form, the use of which can breed resentment as an imposed and unnecessary task.—a.d.w.