
If you're shopping for an EHR system, you might appreciate this advice from a couple of thousand colleagues.
Fam Pract Manag. 2009;16(6):10-16
Robert Edsall is editor-in-chief and editorial director of Family Practice Management. Dr. Adler is a family physician in full-time clinical practice in Tucson, Ariz., and a member of the FPM Board of Editors. He has a Master of Medical Management degree from Tulane University and a Certificate in Healthcare Information Technology from the University of Connecticut. Author disclosure: nothing to disclose.
Given the growing number of family medicine practices moving to electronic health record systems (EHRs), the prospect of government incentives for the purchase of EHRs, and the speed with which technology changes these days, we thought it important to repeat the FPM survey of EHR users that was last conducted in 2007.1
As in 2007, we published the survey instrument in an issue of FPM and made an online version available through the FPM web site.2 However, this year, in an effort to maximize responses, we shortened the survey significantly and offered incentives for usable responses (one Apple iPod Touch and 10 one-year subscriptions to FPM, which were awarded to randomly selected respondents). We also followed up publication of the survey with reminders in FPM e-mail newsletters and sent one e-mail reminder to all AAFP members.
Our intent was not to survey a random sample of AAFP members but to collect as many responses as we could from EHR users. Consequently, as with our previous surveys, the results should not be considered a statistically accurate picture of EHR use among AAFP members but a more informal collection of responses from several hundred colleagues. Given the wide availability of the survey instrument, we accepted responses only from AAFP members as a way of avoiding frivolous responses, multiple responses per individual and other such potential sources of bias.
We were able to collect a total of 2,556 responses, far more than in previous surveys. Of those, 477 were excluded because the respondents said they did not use EHR systems; 48 were excluded because they either did not name the system they use, named a practice management system rather than an EHR system, or named something that we could not verify to be an EHR system; finally, 19 were excluded because they indicated that they had a significant financial interest in or affiliation with a manufacturer or vendor of an EHR program and either did not explain the disclosure further or described what amounted to a major stake in the success of an EHR system (e.g., an ownership interest, a sizable stock purchase or involvement in development of the software). That left 2,012 responses for analysis.
Respondents reported a total of 142 identifiable EHR systems, 120 of which were reported by 12 or fewer respondents. The remaining 22 systems were reported by 13 or more respondents, and these were the systems we set out to provide system-specific results for, using the average of all 2,012 responses as a point of comparison. Unfortunately, the survey instrument design apparently led an unknown number of users of one system (Misys EMR) to indicate that they used another (Misys MyWay, now Allscripts MyWay). Consequently, data for these two systems have been omitted from the system-specific results reported in this corrected version of the report. The remaining 20 systems accounted for 84 percent of respondents (1,699). We chose to focus on these 20 systems because we believed that we had enough responses for each to represent a reasonable spread of opinions on the system. The 20 systems in question are shown on the chart below. (A more detailed list is available in
.) One of the systems, AHLTA, is the U.S. Department of Defense system used in the Military Health System and not commercially available. We kept it in the results nevertheless as a useful point of comparison, at least for systems designed primarily for large practices.
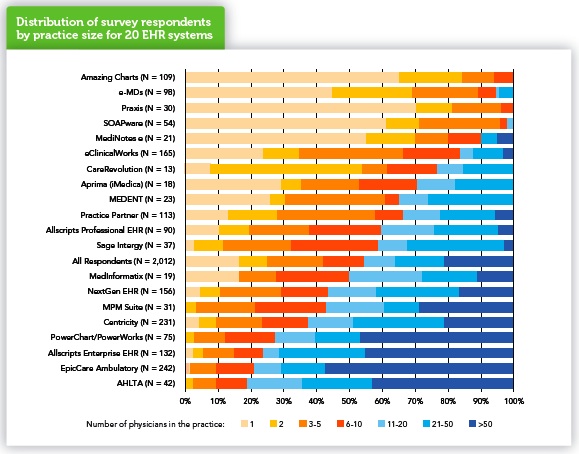
And large practices (large, at least, by family medicine standards) were well represented in the data, with 20 percent of respondents (404) coming from practices of more than 50 physicians. Still, 52 percent of respondents (1,047) came from relatively small practices of 10 or fewer physicians, with 16 percent (320) coming from solo practices. As we expected, certain EHR systems were reported more commonly in small practices and others more commonly in large ones. The practice-size distribution of the 20 analyzed systems is shown above.
Respondents reported experience with their EHR systems ranging from a couple of weeks to 17 years, but the majority (57 percent, or 1,142) said they had from two to six years of experience with the system they reported on. Asked to estimate their skill in using their EHR systems, most respondents said they considered themselves average users (33 percent, or 657) or above average but not expert users of their EHR systems (41 percent, or 816).
To determine users' satisfaction with various aspects of their EHR systems, we asked respondents to indicate their level of agreement or disagreement with each of the following 13 statements, using the scale Strongly Agree, Agree, Neutral, Disagree and Strongly Disagree.
Overall this EHR is easy and intuitive to use.
Documenting care is easy and effective with this EHR.
Finding and reviewing information is easy with this EHR.
Ordering lab tests, referrals and imaging studies is easy with this EHR.
E-prescribing is fast and easy with this EHR.
This EHR provides useful tools for health maintenance (for instance, prompts, alerts and flow sheets).
This EHR provides useful tools for disease management (for instance, disease-specific prompts, alerts, flow sheets and patient lists).
E-messaging and tasking within the office is easy with this EHR.
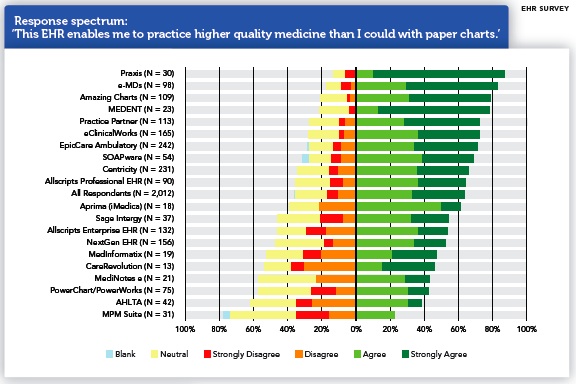
This EHR enables me to practice higher quality medicine than I could with paper charts.
I have a good idea how much this EHR system is costing my practice.
This EHR is worth the expense.
Our EHR vendor provides excellent training and support.
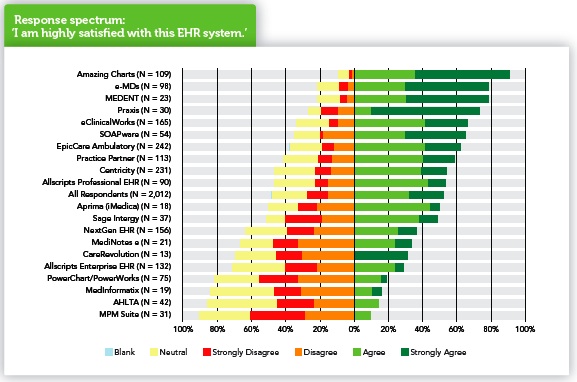
I am highly satisfied with this EHR system.
For a rough, preliminary sense of the survey results, we ranked the 20 systems by the percentage of respondents who indicated that they agreed or strongly agreed with 12 of the 13 statements. (Statement 10, “I have a good idea how much this EHR system is costing my practice” played a different role in the survey; more on that below.) The results are shown in “Survey overview: 20 EHR systems ranked.” To help make sense of the array of numbers, the highest four rankings for each statement are tinted green and the lowest four are tinted orange. The systems are listed by the sum of their ranks; that's why e-MDs is listed ahead of MEDENT even though e-MDs had only one individual first-place ranking (for e-Messaging) while MEDENT had three and Praxis and Amazing Charts, the next two in the table, had four each. The sum of e-MDs rankings, at 34, was slightly better than MEDENT's 37.
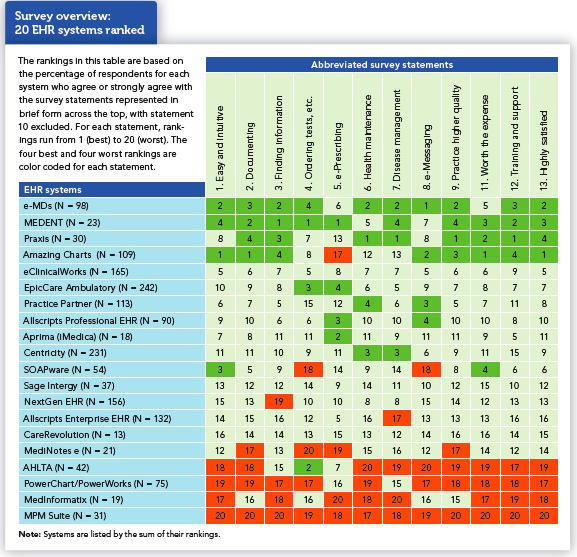
While this is a fairly crude ranking, it does offer some useful insights. First, the high and low rankings do tend to cluster in certain systems, as the areas of green and orange on the chart suggest. Second, three of the four top-ranked systems are the ones most commonly reported by physicians in small practices – e-MDs, Praxis and Amazing Charts – while two of the four lowest ranked systems – AHLTA and Cerner Millennium PowerChart/Power-Works – are among the four most commonly reported in large practices. While we have reason to believe that physicians in smaller practices are more likely to be satisfied with their systems than physicians in larger practices if for no other reason than that they were involved in selecting the system, it's interesting to note that two systems commonly reported in small practices rank in the middle of the pack (SOAPware) and toward the bottom (Medi-Notes e). This may suggest that one of the top-ranked systems mentioned above might be a better bet for small practices. Conversely, two systems commonly reported in large practices rank somewhat higher (Allscripts Enterprise) and considerably higher (EpicCare Ambulatory) than AHLTA and PowerChart/PowerWorks, the other systems most common in large practices.
The ranking table does obscure the details of responses for each statement. To better visualize the full range of responses, we turn to charts like “Response spectrum: ‘Overall this EHR is easy and intuitive to use.’” Each bar in a response spectrum chart represents 100 percent of responses for a given system (or for all systems reported, in the case of the “All Respondents” bar), so all bars on the chart have the same overall length. The number of responses represented by the bar is given in parenthesis after the system name. The bars are divided into sections representing, from left to right, Blank (respondents who left the item blank, if any), Neutral, Strongly Disagree, Disagree, Agree, and Strongly Agree.
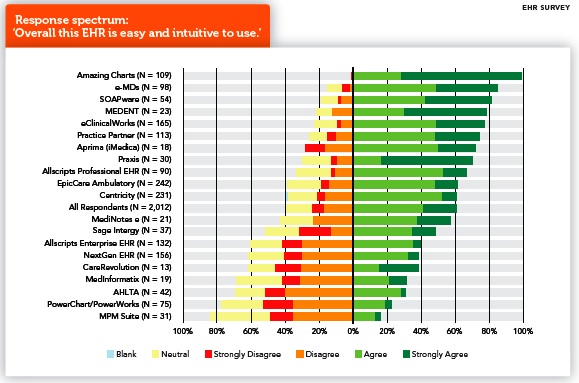
Bar segments for Blank and Neutral are positioned to the left and given only light tints to help highlight the segments representing active agreement or disagreement. Keep in mind, however, that these segments do not represent negative responses and could as easily have been placed on the far right end of the bars. The bars are positioned so the dividing line between agreement and disagreement falls on a midline, so bars that fall mostly to the right of the midline represent a predominance of agreement with the statement, while those that fall mostly to the left indicate a predominance of disagreement. Bars are ordered by the sum of Agree and Strongly Agree responses so that the systems with the most positive responses appear toward the top of the chart. To interpret the chart, though, you need to look at individual bar segments, not just the order of the bars. For instance, while Praxis shows up in eighth place on the list, it received a particularly high percentage of Strongly Agree responses – 53 percent. The only system with a higher percentage was Amazing Charts, which had 71 percent Strongly Agree responses in addition to 28 percent Agree, for a remarkable 99 percent positive response. At the other end of the range was MPM Suite, with 16 percent of users agreeing that it is easy and intuitive to use and only 3 percent strongly agreeing.
While we have room to display only a few response spectrum charts in the following pages,
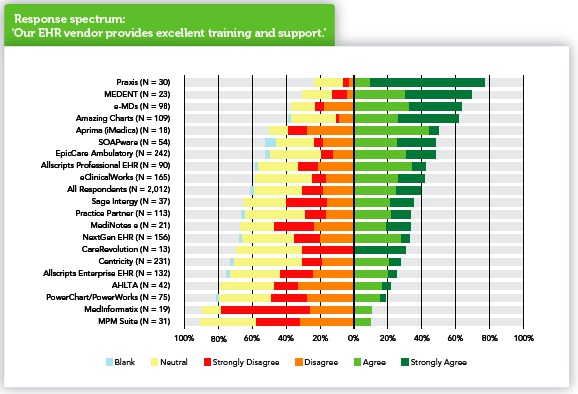
from the online version of this article does provide all 13. The charts we've selected to include here display results for four qualities that seem particularly likely to be important to anyone selecting a system – vendor support, the system's contribution to quality of care, value for investment and overall satisfaction. The same systems tend to show up at or near the top and at or near the bottom of all four charts, as you'd expect from the ranking table, but the charts show more. For instance, you'll note that, on the “training and support” chart, the whole block of 21 bars seems to fall a little farther to the left than on some other charts. Apparently even users of the highest rated systems are not as enthusiastic about the training and support as they are about other aspects. Also, of course, the charts show variations in the relative strength of agreement and disagreement for the 20 systems – although here it's particularly important to pay attention to the N for a given system. For instance, CareRevolution shows up on the “training and support” chart as having respondents who strongly agree, strongly disagree or are neutral, but none who just agree or disagree. While that may be the expression of strong feelings, it may also be an artifact of the low number of responses.
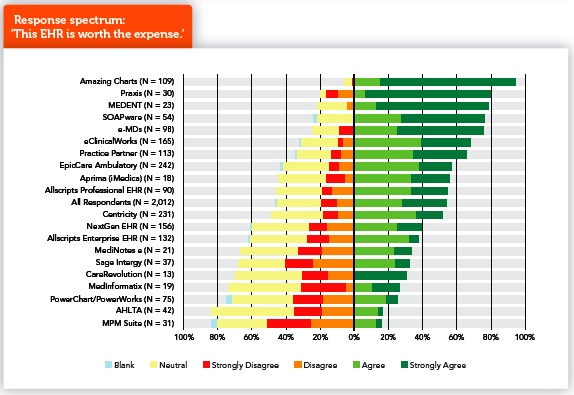
The chart of responses to the statement “This EHR is worth the expense” needs special qualification. Our previous surveys have given us strong indications that many physicians have only vague notions of the cost of their EHR systems, and probably fewer still have actually measured the worth of their systems, so it is dangerous to assume that respondents do in fact know whether their systems are worth the expense. The best way to regard the results on this chart may be as gut-level responses.
We included statement 10 (“I have a good idea how much this EHR system is costing my practice”) in the survey as an attempt to get a better picture of the cost/benefit ratio. Even though that item asks for yet another subjective response, we hoped that it would allow us to get a better picture of cost and benefit by giving us the ability to limit the analysis of worth to those respondents who strongly agreed that they had a good sense of the cost of their EHR. It turns out, however, that of the 358 respondents who strongly agree that they know the cost of their systems, 90 percent (321) also had a hand in selecting those systems – and in this survey, like our earlier ones, physicians who help choose an EHR system are much more likely to be satisfied with it and to consider it worth its cost than those who had no voice in the selection. Hence, we didn't have enough respondents who agreed strongly that they knew the cost of the system and did not have a hand in selecting it to control for the effect of having helped select the system.
As in past surveys, our goal was not to pick clear “winners” in terms of user satisfaction. The system characteristics covered in the survey may have different weights for different practices, and we are conscious of several limitations of the survey. That respondents were self-selected may mean that the survey attracted EHR enthusiasts, or at least physicians with particularly strong feelings about their EHRs, positive or negative. Moreover, cell size is a problem in two senses. By considering only systems for which we had 13 or more respondents, we necessarily omitted numerous systems; on the other hand, by including systems for which we had as few as 13 respondents, we risked additional bias. As we said to begin with, it's probably best to consider the survey results as input you'd get from a few hundred colleagues who volunteered to report on their EHR experience. That said, we believe that the results presented in this article and its online appendix can help any family medicine practice considering the purchase of an EHR system. We hope you find them useful.
