Understanding the power of quality data and then starting with a few specific measures leads to improved blood pressure rates.

High blood pressure is one of many chronic conditions demanding our attention as we help our patients live better lives. Like much of the work we do in the trenches every day, gains in the area of hypertension can be slow and small. It is challenging, for example, to persuade a busy farmer that blood pressure control is important and, even though harvest is right around the corner, he needs to return in a few weeks to make sure things are better with the new medication.
Sometimes you lose sight of why you are trying to solve a health problem – to actually create a long-term benefit in the individual patient's health – when how to do it seems tedious and difficult. To address the ongoing challenges of motivating physicians and staff toward quality improvement goals, my practice teamed up with four other family medicine practices in north-central Kansas. Our combined solution was multifaceted – involving focused problem-solving, best practices, and greater use of data – and was ultimately successful.
IN THE AUTHOR'S OWN WORDS
Dr. Brull provides additional perspective on how her practice improved its rate of hypertension control.
History
Post Rock Family Medicine is comprised of five separate practices and includes five family physicians, three nurse practitioners, one physician assistant, a certified nurse midwife, and a shared staff of about 30. Since we all practice in the same county and work well together, we have chosen to remain autonomous but collaborate on many fronts, including electronic health record (EHR) systems, staffing needs, physical space, purchasing, and, perhaps most important, quality improvement.
We have steadily developed our expertise in quality improvement, beginning in 2004 with a state diabetes registry program that taught my nurses and me the value of having patient-specific reports at the point of care and population reports for investigating trends and goal planning. Culture is critical to quality improvement work, and this program laid a foundation for future data capture and analysis.
In 2011, the entire group began moving toward the patient-centered medical home (PCMH) model, a process that required us to revisit our procedures, improve patient communication, run care quality reports, and examine those reports as a group. After noticing large deficiencies in several quarterly reports, we decided in late 2012 to formalize our process for quality improvement. We began following 74 unique quality metrics across 11 chronic and preventive care suites, including hypertension.
All staff viewed the individual provider and team data. It was the providers' choice that this data not be de-identified. Following each review, we would pick a targeted measure to improve. We tended to focus first on process measures, such as making sure a certain lab test got done. Once those process measures were being completed more than 90 percent of the time, we moved on to the more difficult outcome measures, such as getting certain test results to acceptable levels.
Our review and action plans were influenced by Switch, a book by Chip and Dan Heath that teaches readers to identify “bright spots” (well-performing teams that can share their best practices across the entire group) and “shrink the change” (break an overwhelming task into smaller components that are more manageable to start and finish).1
This article focuses on hypertension, an area where we found great success.
How we approached hypertension
Following our quarterly review of quality measures, we chose to examine three specific hypertension measures, which would form our initial improvement targets:
- A process measure: Did we actually check the blood pressure of patients with hypertension?
- A best-practices measure: Were patients with hypertension and renal disease (i.e., those with a glomerular filtration rate of less than 60 milliliters per minute), prescribed an angiotensin-converting-enzyme (ACE) inhibitor or angiotensin receptor blocker (ARB)?
- An outcome measure: Were patients with hypertension controlling their blood pressure?
Blood pressure checks. Post Rock Family Medicine has 1,503 patients with high blood pressure, and my office alone has 229. Our EHR allowed us to identify all of the patients seen by each provider, regardless of the assigned primary provider, and our web-based registry allowed us to identify all of the patients assigned to a particular provider, regardless of whether they had been seen recently.
We learned that when patients with hypertension were seen for an office visit, we were very good at remembering to check their blood pressure (96 percent originally). But when patients failed to return for follow-up visits and stopped taking medications, we did not have a good system for ensuring that we reached out to them and rescheduled. We found that almost 10 percent of our patients with hypertension had not had their blood pressures checked in the previous year.
Although fixing this seemed simple, when we identified the patients affected we discovered there were 160 for the entire group. We “shrunk the change,” however, and assigned the patients to care teams. As a result, my two nurses had only six patients to contact. We were able to reach out to people who had stopped taking medicines and stopped coming to appointments and emphasize the importance of regular follow-up. Most patients took us up on our offer for an office visit, and the group's performance has improved, having measured blood pressure for 94 percent of all patients with hypertension in the past year (compared with 90 percent originally). My team, which started out higher than the group at 97.5 percent, has now checked 99.1 percent of all patients with hypertension in the past year.
The holdouts were typically patients who had moved and were difficult to find, said they couldn't afford the visit, or just didn't want to admit that they had high blood pressure. We are a small community and have personal relationships with most of our patients, making the job of persuading them a little easier. It is also helpful that I don't have to share my nurses with another physician and frequently emphasize to my staff how important it is that we have excellent quality numbers.
Patients with hypertension and renal disease on ACE or ARB. We chose to focus on this measure because the number of patients with hypertension and renal disease (46 for my team) was small enough to tackle and the percentage of those who were prescribed an ACE or ARB (63 percent) was shockingly low enough to motivate us.
We knew that addressing this goal would most likely need to happen at face-to-face visits; changing a medication regimen for the sake of evidence-based practice requires some discussion with the patient, especially one who is stable and happy with the current medications. We were concerned that achieving the goal might get lost in the hustle and bustle of the routine office visit, but we didn't want to make patients come in for a special visit. After considering several ideas, we decided to use a point-of-care, patient-specific dashboard to identify gaps in care, including this measure. We use a stand-alone web-based registry program called MDInsight, which we began using as part of our PCMH transformation.
My team emphasizes needed changes or services by highlighting the printed dashboard during previsit planning and giving it to the provider (me) at each chronic visit. This draws my attention not only to the ACE/ARB issue but also to any other chronic or preventive needs a patient might have. This approach doesn't add significant time to visits because we tackle only the most important one or two care gaps and save other gaps for future visits.
Four months after implementation of this strategy, the full group's rate improved from 58 percent to 87.5 percent for ACE/ARB while my team's rate increased to 93 percent. We also saw measures increase in several other care suites, and we made dashboards a “best practice” for teams to implement.
Blood pressure control. This measure was probably the most difficult to improve because of the number of variables: patient compliance with treatment, affordability and availability of medications, availability of a healthy diet, staff blood pressure measurement techniques, external stressors for the patient, late physicians making patients angry on the date of their visit, etc.
Initially, our measurements showed that 69 percent of all patients with hypertension seen by the entire group had their blood pressure under control. Although this was not terrible (the 50th percentile nationally was 64 percent in 2013),2 we were not satisfied with our rate of control and began making changes:
- We ensured that all staff knew how to accurately take a patient's blood pressure. This includes making sure the patient is seated with feet flat on the floor, has his or her arm resting on a stable surface at heart level, and has been sitting quietly for at least five minutes before the measurement is taken using a blood pressure cuff of appropriate size. Although we aren't strict about following this protocol for the initial blood pressure reading, we do mandate that it be followed if the initial measurement is elevated. We document all blood pressures measured at a visit, and our EHR captures the time stamp of each measurement.
- We formalized a policy for when repeat measurements are necessary. From the time the patient is checked in to the time the patient is seen by the provider, the nursing staff often has time to perform one or more repeat blood pressure measurements. We want at least two measurements if a patient's initial measurement is abnormal. We placed a complete set of blood pressure cuff sizes in each room with a stethoscope to ensure that insufficient equipment did not become a barrier to accurate measurement.
- We used the patient-specific dashboard to identify patients whose last blood pressure showed a lack of control. Nursing staff highlighted this information to draw the provider's attention to it. This approach often meant the difference between providers thinking, “It's just one high blood pressure; next time it will be fine,” and identifying a problematic trend.
- We developed provider expectations for treating elevated blood pressure at the visit. If a patient's blood pressure was still high after repeated testing, the provider was expected to take action at that visit. The action could be adjusting medication, recommending a modified diet, suggesting increased exercise or weight loss, or scheduling a short interval follow-up visit. Patients resistant to medication change could often be persuaded to return in seven to 10 days to see if their blood pressure had improved. If it remained high, they were often willing to make a medication adjustment.
Addressing these four targets has led to great success – almost 87 percent of my office's patients had their blood pressure under control at their most recent office visit, up from 73 percent initially. (See “Hypertension control rate.”) The rate for the entire practice group is now more than 85 percent.
HYPERTENSION CONTROL RATE
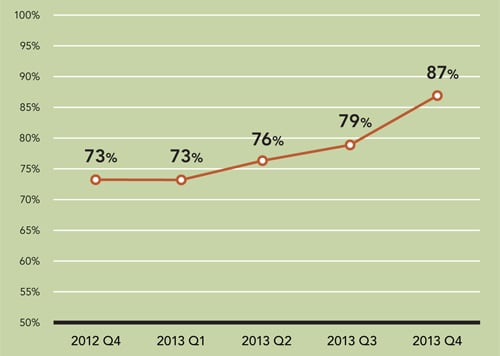
The practice found that all of its process and best practice improvements ultimately increased the percentage of patients with hypertension who were controlling their blood pressure.
Results and keeping it going
All of our individual offices improved care quality, efficiency, and, most important, our patients' health. These improvements continue to be refined as we incorporate lessons we have learned from treating other care suites and formalize more of our best practices.
Following my office's success in improving blood pressure control, we applied for and were named a 2013 Hypertension Control Challenge Champion by the U.S. Department of Health & Human Services' Million Hearts Initiative.
Our entire group is still pursuing continuous quality improvement and sharing data with all staff. Each quality measure is reviewed quarterly, provider-specific data is shared at every staff meeting, and our teams take ownership of their rates. Because they want to achieve good outcomes, they are fairly self-motivated.
Although my office has benefitted from the input and assistance of the other practices that make up Post Rock Family Medicine, I would have tackled this quality improvement project on my own. It's actually easier to motivate a small staff than an entire group.
I advise other physicians to start small, pick a single measure to which you have access to the data and are interested in changing, and make a commitment to keep doing quality improvement in your setting. Even if your efforts don't seem to be making a difference, rebuild your planning and evaluation strategy and start again.