The Match: Getting into a Residency Program

The Basics: What is the Match?
The Match process is a uniform system by which residency candidates and residency programs simultaneously “match” to fill first-year and second-year post-graduate training positions accredited by the Accreditation Council for Graduate Medical Education (ACGME). The National Resident Matching Program®(NRMP®) instituted and maintains the Match system.
Unless they have specifically enrolled in the Military Match, which occurs in December, all graduating medical students and medical school graduates seeking a residency position should enroll in the Match.
How Do I Match into a Residency Program?
Matching can be broken down into six major steps. Each applicant’s Match task list will include a number of plans and assignments within these six categories.
Steps to match:
1 Build professional and academic experience.
2 Research residency programs in your chosen medical specialty.
3 Apply to residency programs.
4 Interview with residency programs.
5 Rank residency programs.
6 Learn where you matched on Match Day, the third Friday in March.
Applicants sometimes go through an additional step on the path to matching: entering the Supplemental Offer and Acceptance Program. Through this program, the week before Match day, applicants who did not match and residency programs that did not fill all of their positions have the opportunity to connect and receive and make offers.

Find Your Match with the AAFP
Ready to begin your journey to residency? The Match may be a complex process, but making it work for you doesn't have to be. The AAFP has articles, tools, webinars, and events to support Match applicants every step of the way. It's free to join the AAFP for complete access to everything, and you can add your membership status to your ERAS application.
5 Tips From Graduates
Navigating the last leg of your medical school journey toward a career-defining destination — Match — brings both excitement and stress. It’s not an easy process. As some of tomorrow’s family physicians can tell you, though, Match ultimately gives you even more than you put into it.
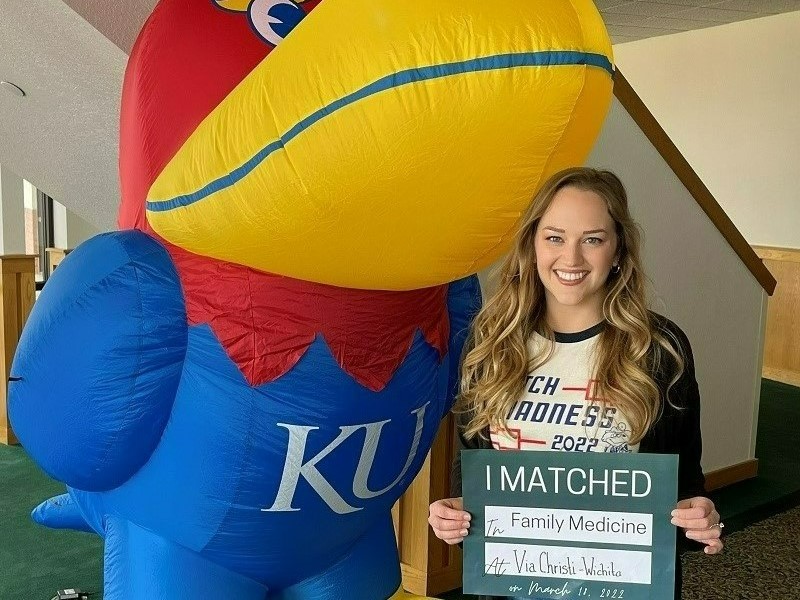
Morgan Weiler, MD
Matched: Via Christi-Wichita Family Medicine
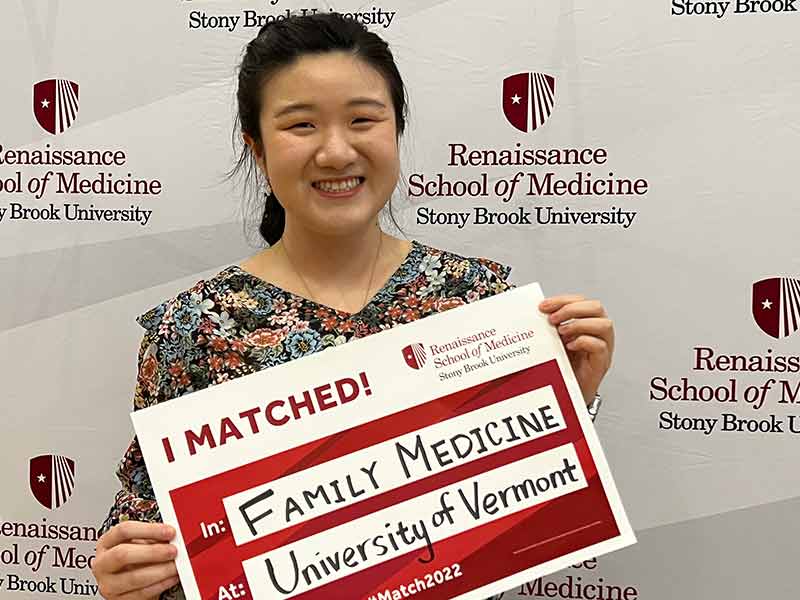
Kate (Jiayu) Tian, MD
Matched: University of Vermont Family Medicine
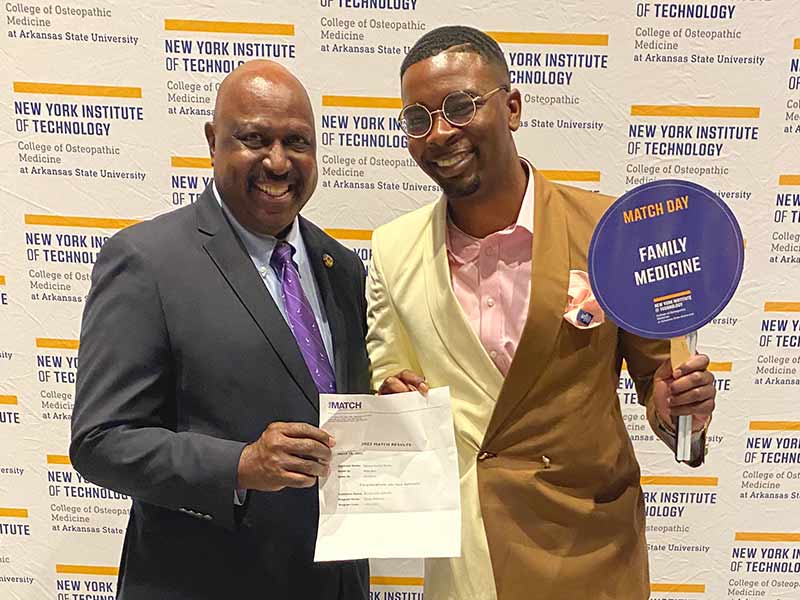
Dakarai Moton, DO
Matched: Saint Louis University
TIP 1: Make a Checklist
Securing your residency takes more than just exams and grades. You’ll need to demonstrate professional development and present your intangible qualities, too. The sooner you determine your goals and how you’ll meet them, the better. Creating a checklist can help. You can find a checklist for each year of medical school in the Strolling Through the Match guidebook.
"Create a to-do list! Marking items off feels great and it is also a great way to see what you have left to do! I wrote my personal statement in the summer, and I am glad I did so. When you ask for letters of recommendation, many will ask for an updated CV and personal statement! Having those ready will be important." - Morgan Weiler, MD
TIP 2: Rotations & Electives
Add rotations and electives to your checklist and make sure they help you diversify your family medicine experiences. This shows recruiters that you’re committed to the specialty. In the 2021 NRMP Program Director Survey, more than 95% of family medicine residency directors said that perceptible commitment was central to their interview choices.
“The best advice I received was to sign up for rotations that are the most challenging to you. My weakest subject is nephrology and electrolyte management. I did a 2-week rotation with a nephrologist, and it was extremely helpful! Challenging, yes, but worth it!” – Morgan Weiler, MD
TIP 3: Selecting a Specialty
Deciding on a specialty is both challenging and exciting. Put the specialties that interest you on your checklist, take every opportunity to shadow or rotate through them, then think about what you’ve experienced and how it aligns with your professional goals.
"First step is to identify a few specialties of interest if possible and reach out to mentors, both physicians or senior medical students. Understanding why others choose a certain specialty is very helpful, especially if you resonate with someone’s story. Since everyone’s path is unique, talking to multiple mentors can help clearing up if one specialty might be a good fit. Additionally, going to conferences is a great way to identify mentors as participants tend to have strong interests in teaching and mentoring." - Kate Tian, MD
TIP 4: Do Your Research When Picking Your Program
With more than 700 family medicine residency programs, how do you figure out which program is right for you? Once you’ve considered location, practice settings, and other basics, concentrate your research on the programs that appeal to your unique, subjective interests. Are there away rotations or conference opportunities? Have you talked with alumni or current residents and been moved by what they’ve told you?
"I created my own excel spreadsheet with prioritized information from FREIDA and AAMC and began to highlight the spreadsheet with highs, lows, and negotiable components to make the overall best decision. Stay organized!" - Dakarai Moton, DO
TIP 5: Make Residency Interviews Work for You
The interview isn’t just to help the program. It’s also your chance to determine if a program is right for you. Prepare your own questions as you also consider how to convey to the interviewer that you’d be a welcome addition.
"I read through the section 'Interviewing at Residency Programs' in Strolling and had prepared answers to commonly asked questions beforehand. Before each interview day, I reviewed my notes about the program and all the documents emailed to me and on the program website. I also drafted questions to ask during resident dinner and during each interview based on the 'Suggested Interview Questions' in Strolling." - Kate Tian, MD
Match Resources

Strolling Through the Match
This guide to matching has helped thousands of applicants find their way into the right family medicine residency program. Strolling Through the Match is updated each year with the most current guidance and data.
Download or order your free copy of Strolling Through the Match.
Family Medicine Residency Directory
Discover the right family medicine residency program for you by searching the AAFP's residency directory.
AAFP app
Research family medicine residencies, generate an interview question list, take notes on programs, and customize a scorecard to rank your favorite programs.
Residency Interview Guide
The guide features tips for planning your trips and preparing for interviews - including sample questions - as well as advice regarding virtual interviews.
FUTURE (formerly National Conference)
It's never too early to start considering your options. Come to FUTURE, July 30—August 1, 2026, in Kansas City, MO. Meet more than 400 residency programs and capture the energy of family medicine residents and med students.
AAMC's Apply Smart data
This data can help you determine how many programs to apply to and avoid over- or under-applying.
Get familiar with the NRMP Match calendar
The NRMP, which conducts the Main Residency Match, provides updated calendars each year, and serves as a resource for Match rules, yearly trends, and more.
Not an AAFP member? Medical student membership is FREE and applying is quick and easy.
Residency Faculty and Staff
If you're residency faculty or staff looking for Match information and tools for your program, we've got you covered. Visit the AAFP's Residency Program Central.