SARS-CoV-2 is the novel coronavirus that causes COVID-19. The spectrum of asymptomatic, presymptomatic, and symptomatic SARS-CoV-2 transmission presents challenges for evaluating SARS-CoV-2 test performance for diagnostic or screening purposes and for interpreting test results. Molecular and antigen tests can detect current SARS-CoV-2 infection and are used to diagnose COVID-19. Clinicians should consider a test's characteristics, test timing in relation to symptom onset, and the pretest probability of disease when interpreting results. Molecular and antigen SARS-CoV-2 tests both have high specificity. However, antigen tests generally have lower sensitivity and thus greater potential for false-negative results. Pretest probability of disease should be based on a patient's exposure to someone with a confirmed or probable case, signs or symptoms of COVID-19, local or population-specific COVID-19 prevalence, and presence of an alternative diagnosis. Using a leaf plot is an efficient way to visualize posttest probability of disease based on estimated pretest probability and the test's sensitivity and specificity. A negative molecular or antigen test result might not rule out SARS-CoV-2 infection when pretest probability is high, depending on the test's sensitivity. A symptom-based approach is preferred over a test-based approach for discontinuing isolation precautions for most patients with COVID-19 because prolonged shedding of viral RNA does not necessarily correlate with infectivity. Antibody tests might help identify past SARS-CoV-2 infection if performed two to four weeks after symptom onset; however, because of uncertainty about the extent and durability of postinfection or vaccine-induced immunity, they should not yet be used to infer immunity or guide discontinuation of personal protective measures.
SARS-CoV-2 is the novel coronavirus that causes COVID-19. It can be transmitted from infected individuals who never develop symptoms (asymptomatic), just before the onset of symptoms (presymptomatic), and when symptoms are present (symptomatic).1–3 About 20% to 40% of infections are asymptomatic, which is more common in younger patients.4–7 The spectrum of transmission patterns poses challenges for evaluating test performance and interpreting test results when used for diagnostic or screening purposes.
SORT: KEY RECOMMENDATIONS FOR PRACTICE
A = consistent, good-quality patient-oriented evidence; B = inconsistent or limited-quality patient-oriented evidence; C = consensus, disease-oriented evidence, usual practice, expert opinion, or case series. For information about the SORT evidence rating system, go to https://www.aafp.org/afpsort.
Molecular and antigen tests can detect current SARS-CoV-2 infection and are used to diagnose COVID-19 (Table 1).8,9 Molecular tests, such as reverse transcriptase polymerase chain reaction (RT-PCR), detect viral nucleic acids, whereas antigen tests employ immunoassays that detect viral proteins. Molecular tests are generally more sensitive than antigen tests because they amplify collected nucleic acids and thus can detect even small amounts of virus.9,10 Serologic tests detect antibodies (immunoglobulin [Ig] M or G) produced after acute infection or vaccination and are not used to diagnose current SARS-CoV-2 infection.9,11
TABLE 1. Summary of SARS-CoV-2 Molecular and Antigen Test Features
| Feature | Molecular tests | Antigen tests |
|---|---|---|
| Type | Reverse transcriptase polymerase chain reaction and nucleic acid amplification tests | Rapid tests* |
| Purpose | Detect current infection | Detect current infection |
| Detection target | Viral RNA | Viral proteins (e.g., nucleocapsid protein) |
| Specimen types† | Nasopharyngeal, nasal, sputum, saliva | Nasopharyngeal, nasal |
| Point-of-care use | Most are not used at the point of care | Most are used at the point of care |
| Sensitivity | Varies but generally high | Moderate |
| Specificity | High | High |
| Turnaround time | 15 minutes to days | Usually 10 to 30 minutes |
| Public health reporting | Electronic laboratory reporting is more common | A process is needed to report point-of-care results to public health departments |
| Cost | Moderate (approximately $100 per test) | Low (approximately $5 to $50 per test) |
*—Some molecular tests are referred to as rapid.
†—Lapses in proper specimen collection, storage, handling, and processing can affect results.
Adapted from Centers for Disease Control and Prevention. Interim guidance for antigen testing for SARS-CoV-2. Updated December 16, 2020. Accessed February 14, 2021. https://www.cdc.gov/coronavirus/2019-ncov/lab/resources/antigen-tests-guidelines.html, with additional information from reference 9.
Because of the rapid production and evaluation of new SARS-CoV-2 tests, clinicians should ensure that they are using current guidelines. As of March 15, 2021, there were 256 molecular tests and 15 antigen tests with U.S. Food and Drug Administration (FDA) Emergency Use Authorization.12 This article addresses common questions about SARS-CoV-2 testing and presents an approach to interpreting diagnostic test results.
How Do Test Characteristics Such as Sensitivity, Specificity, and Percent Agreement Inform SARS-CoV-2 Diagnostic Test Interpretation?
Molecular and antigen tests both have high specificity. However, antigen tests and some molecular tests have lower sensitivity and thus greater potential for false-negative results.8,13 Percent agreement is reported in place of sensitivity or specificity when a nonstandard reference is used to evaluate a new test.14
EVIDENCE SUMMARY
Diagnostic sensitivity is the ability of a test to identify people who have a disease (i.e., the percentage of those with the disease who test positive).15 Diagnostic specificity is the ability of a test to identify those without disease (i.e., the percentage of people without the disease who test negative).15 However, with rapid production of new SARS-CoV-2 tests, analytical test characteristics are often reported initially rather than diagnostic sensitivity. For example, analytical sensitivity corresponds to the smallest amount of SARS-CoV-2 that can be detected, often called the limit of detection. Analytical sensitivity does not necessarily correspond to diagnostic sensitivity.16 Thus, it is important to evaluate SARS-CoV-2 diagnostic test performance in patients and populations.
A Cochrane review, with limited applicability to clinical settings, included 13 evaluations of four SARS-CoV-2 molecular tests, including ID Now and Xpert Xpress (Table 213,17 ), on 2,255 samples and found an average sensitivity of 95.2% (95% CI, 86.7% to 98.3%) and specificity of 98.9% (95% CI, 97.3% to 99.5%).13 The range of sensitivity was 68% to 100%. The same Cochrane review included eight evaluations of five antigen tests on 943 samples and found an average sensitivity of 56.2% (95% CI, 29.5% to 79.8%) and specificity of 99.5% (95% CI, 98.1% to 99.9%). The range of sensitivity was 0% to 94%. The antigen test findings have minimal applicability in the United States because the review included no tests with FDA Emergency Use Authorization.
TABLE 2. Test Characteristics and Performance of Selected SARS-CoV-2 Molecular and Antigen Tests
| Test* | Sensitivity (95% CI) | Specificity (95% CI) | 1% disease prevalence | 10% disease prevalence | 50% disease prevalence | LR+ | LR− | |||
|---|---|---|---|---|---|---|---|---|---|---|
| PPV (%) | NPV (%) | PPV (%) | NPV (%) | PPV (%) | NPV (%) | |||||
| Xpert Xpress (Cepheid) | 99.4 (98.0 to 99.8) | 96.8 (90.6 to 99.0) | 24 | 100 | 78 | 100 | 97 | 99 | 31 | 0.006 |
| ID Now (Abbott) | 76.8 (72.9 to 80.3) | 99.6 (98.4 to 99.9) | 66 | 100 | 96 | 97 | 99 | 81 | 192 | 0.233 |
| Sofia SARS Antigen FIA (Quidel), with symptoms | 80.0 (64.4 to 90.9) | 98.9 (96.2 to 99.9) | 42 | 100 | 89 | 98 | 99 | 83 | 75 | 0.202 |
| Sofia SARS Antigen FIA (Quidel), without symptoms | 41.2 (18.4 to 67.1) | 98.4 (97.3 to 99.1) | 20 | 99 | 73 | 94 | 96 | 63 | 25 | 0.598 |
FIA = fluorescent immunoassay; LR– = negative likelihood ratio; LR+ = positive likelihood ratio; NPV = negative predictive value; PPV = positive predictive value.
*—Xpress and Abbott ID Now data did not specify presence or absence of symptoms.
In a university population of 1,098 samples (Table 213,17 ), an evaluation of the Sofia SARS Antigen FIA test, which has FDA Emergency Use Authorization, found a sensitivity of 80.0% (95% CI, 64.4% to 90.9%) and specificity of 98.9% (95% CI, 96.2% to 99.9%) in symptomatic people (n = 227). In asymptomatic people (n = 871), sensitivity was 41.2% (95% CI, 18.4% to 67.1%) and specificity was 98.4% (95% CI, 97.3% to 99.1%).17
Two large evaluations of the BinaxNOW antigen test, which has FDA Emergency Use Authorization, had different performance results. For symptomatic people older than 10 years (n = 827) at a community testing event in Arizona, the test had a sensitivity of 64.2% (95% CI, 56.7% to 71.3%) and specificity of 100.0% (95% CI, 99.4% to 100.0%).18 In asymptomatic people older than 10 years (n = 2,592) at the same event, the sensitivity was 35.8% (95% CI, 27.3% to 44.9%) and specificity was 99.8% (95% CI, 99.6% to 100.0%). However, in specimens positive on viral culture, an indicator of infectious virus presence, sensitivity was 92.6% for symptomatic people and 78.6% for asymptomatic people.18 For people of all ages and symptom status (n = 3,302) at a community testing event in San Francisco, the overall sensitivity was 89% (95% CI, 84.3% to 92.7%), and the specificity was 99.9% (95% CI, 99.7% to 100.0%).19
The FDA has developed a reference standard for molecular SARS-CoV-2 diagnostic tests and lists analytical sensitivity test comparisons at https://www.fda.gov/medical-devices/coronavirus-covid-19-and-medical-devices/sars-cov-2-reference-panel-comparative-data. When a reference standard is not used or is unavailable for molecular and antigen tests with FDA Emergency Use Authorization, positive percent agreement and negative percent agreement are reported instead of sensitivity and specificity.14 Positive percent agreement is the percentage of total positive tests that are the same when comparing a new test and a nonreference standard. Negative percent agreement is the percentage of total negative tests that are the same when comparing a new test and a nonreference standard.14 For current antigen tests with FDA Emergency Use Authorization, reported positive percent agreement ranges from 80% to 97.6% and reported negative percent agreement ranges from 96.6% to 100%.12,20
How Does Test Timing in Relation to Symptom Onset Inform SARS-CoV-2 Test Interpretation?
Because viral load decreases after symptom onset, false-negative results are more likely with antigen tests that are performed more than five days after symptom onset.8,12,20–23
EVIDENCE SUMMARY
Multiple studies have observed decreasing viral load during the week after onset of COVID-19 symptoms.21–23 Molecular tests are more likely than antigen tests to detect SARS-CoV-2 despite this viral load decrease because molecular tests have higher sensitivity. The instructions of all current antigen tests with FDA Emergency Use Authorization warn of the risk of false-negative results from specimens collected five to 12 days after symptom onset because corresponding antigen levels may fall below the level of detection.8,12,17
Validation of molecular and antigen test performance in persons with and without symptoms remains an urgent research need.13,24,25 However, increased testing frequency as part of a screening program may compensate for limits in test sensitivity, particularly with antigen tests, and facilitate timely isolation of people who are infectious.8,24,26
How Does Pretest Probability of Disease Inform SARS-CoV-2 Test Interpretation?
Pretest probability refers to the estimated likelihood of disease before testing. Pretest probability should be based on a patient's exposure to someone with a confirmed or probable case, signs or symptoms of COVID-19, local or population-specific COVID-19 prevalence, and presence of an alternative diagnosis.8,25,27
EVIDENCE SUMMARY
Exposure to SARS-CoV-2 and COVID-19 Signs and Symptoms. Peak COVID-19 infectiousness occurs at and just before symptom onset.3 Known or suspected exposure to a person with a confirmed or probable case of COVID-19 increases pretest probability of disease. Signs and symptoms of COVID-19 increase the pretest probability by supporting a clinical diagnosis. The timing of testing after exposure also matters. The incubation period, or time from exposure to symptoms, for COVID-19 ranges from two to 14 days, with a median of 5.1 days (97.5% of patients with the disease become symptomatic by 11.5 days).28 Based on postquarantine transmission risk modeling, Centers for Disease Control and Prevention recommendations include an option to shorten the standard 14-day quarantine to seven days for patients with a negative SARS-CoV-2 diagnostic test result from a sample collected between five and seven days post-exposure.29 However, not all jurisdictions have adopted this option.
COVID-19 Prevalence. Disease prevalence affects the predictive value, or the likelihood a person truly does or does not have a disease based on a test result.8,13 Higher disease prevalence increases the predictive value of a positive test result but decreases the predictive value of a negative test result (Table 213,17 ). For example, a negative test result from a resident of a skilled nursing facility where a known outbreak is occurring has a lower negative predictive value because of the high disease prevalence. Likewise, when the pretest probability is low, such as in an asymptomatic individual in a low-prevalence setting, positive predictive value is lower and false-positive results are more common. Clinicians should therefore be familiar with COVID-19 prevalence within populations undergoing testing, as well as seven- to 10-day averages of community disease prevalence as reported by health departments.8
Alternative Diagnosis. An alternative diagnosis, such as influenza, decreases pretest probability, whereas absence of an alternative diagnosis increases it.27
How Can Posttest Probability of Disease Be Determined?
A leaf plot provides a visual representation of pre- and posttest probability based on test sensitivity and specificity.
EVIDENCE SUMMARY
After estimating pretest probability, clinicians must determine the probability of disease based on the test result (posttest probability). Although converting pretest to posttest odds and using likelihood ratios can assist in determining how much to adjust pretest probability given a test result, this approach is cumbersome in practice. Likewise, interpreting a negative result in the context of high pretest probability, or a positive result when pretest probability is low, can be challenging.
A leaf plot offers an alternative through visual representation of pre- and posttest probability based on designated test sensitivity and specificity.30 Figure 1 shows three leaf plots with the same specificity (98%) but different sensitivities: 70%, 90%, and 99%. To read a leaf plot, the pretest probability is selected on the positive sloped central line (leaf's vein). The conversion to posttest probability with a positive result is the increase in height to the red line. To determine the posttest probability with a negative result, draw a vertical line down to the blue line, and see where it intersects the y-axis. For example, on the leaf plot in Figure 1 with a 90% sensitivity, a 50% pretest probability along the dotted line corresponds to a 10% posttest probability on the blue line in a patient with a negative result. To determine the posttest probability for a positive result, draw a vertical line up from the diagonal to the red line, and see where it intersects the y-axis (in this case, it is approximately 98%). The clinician must judge what threshold of posttest probability determines infection status.25
FIGURE 1.
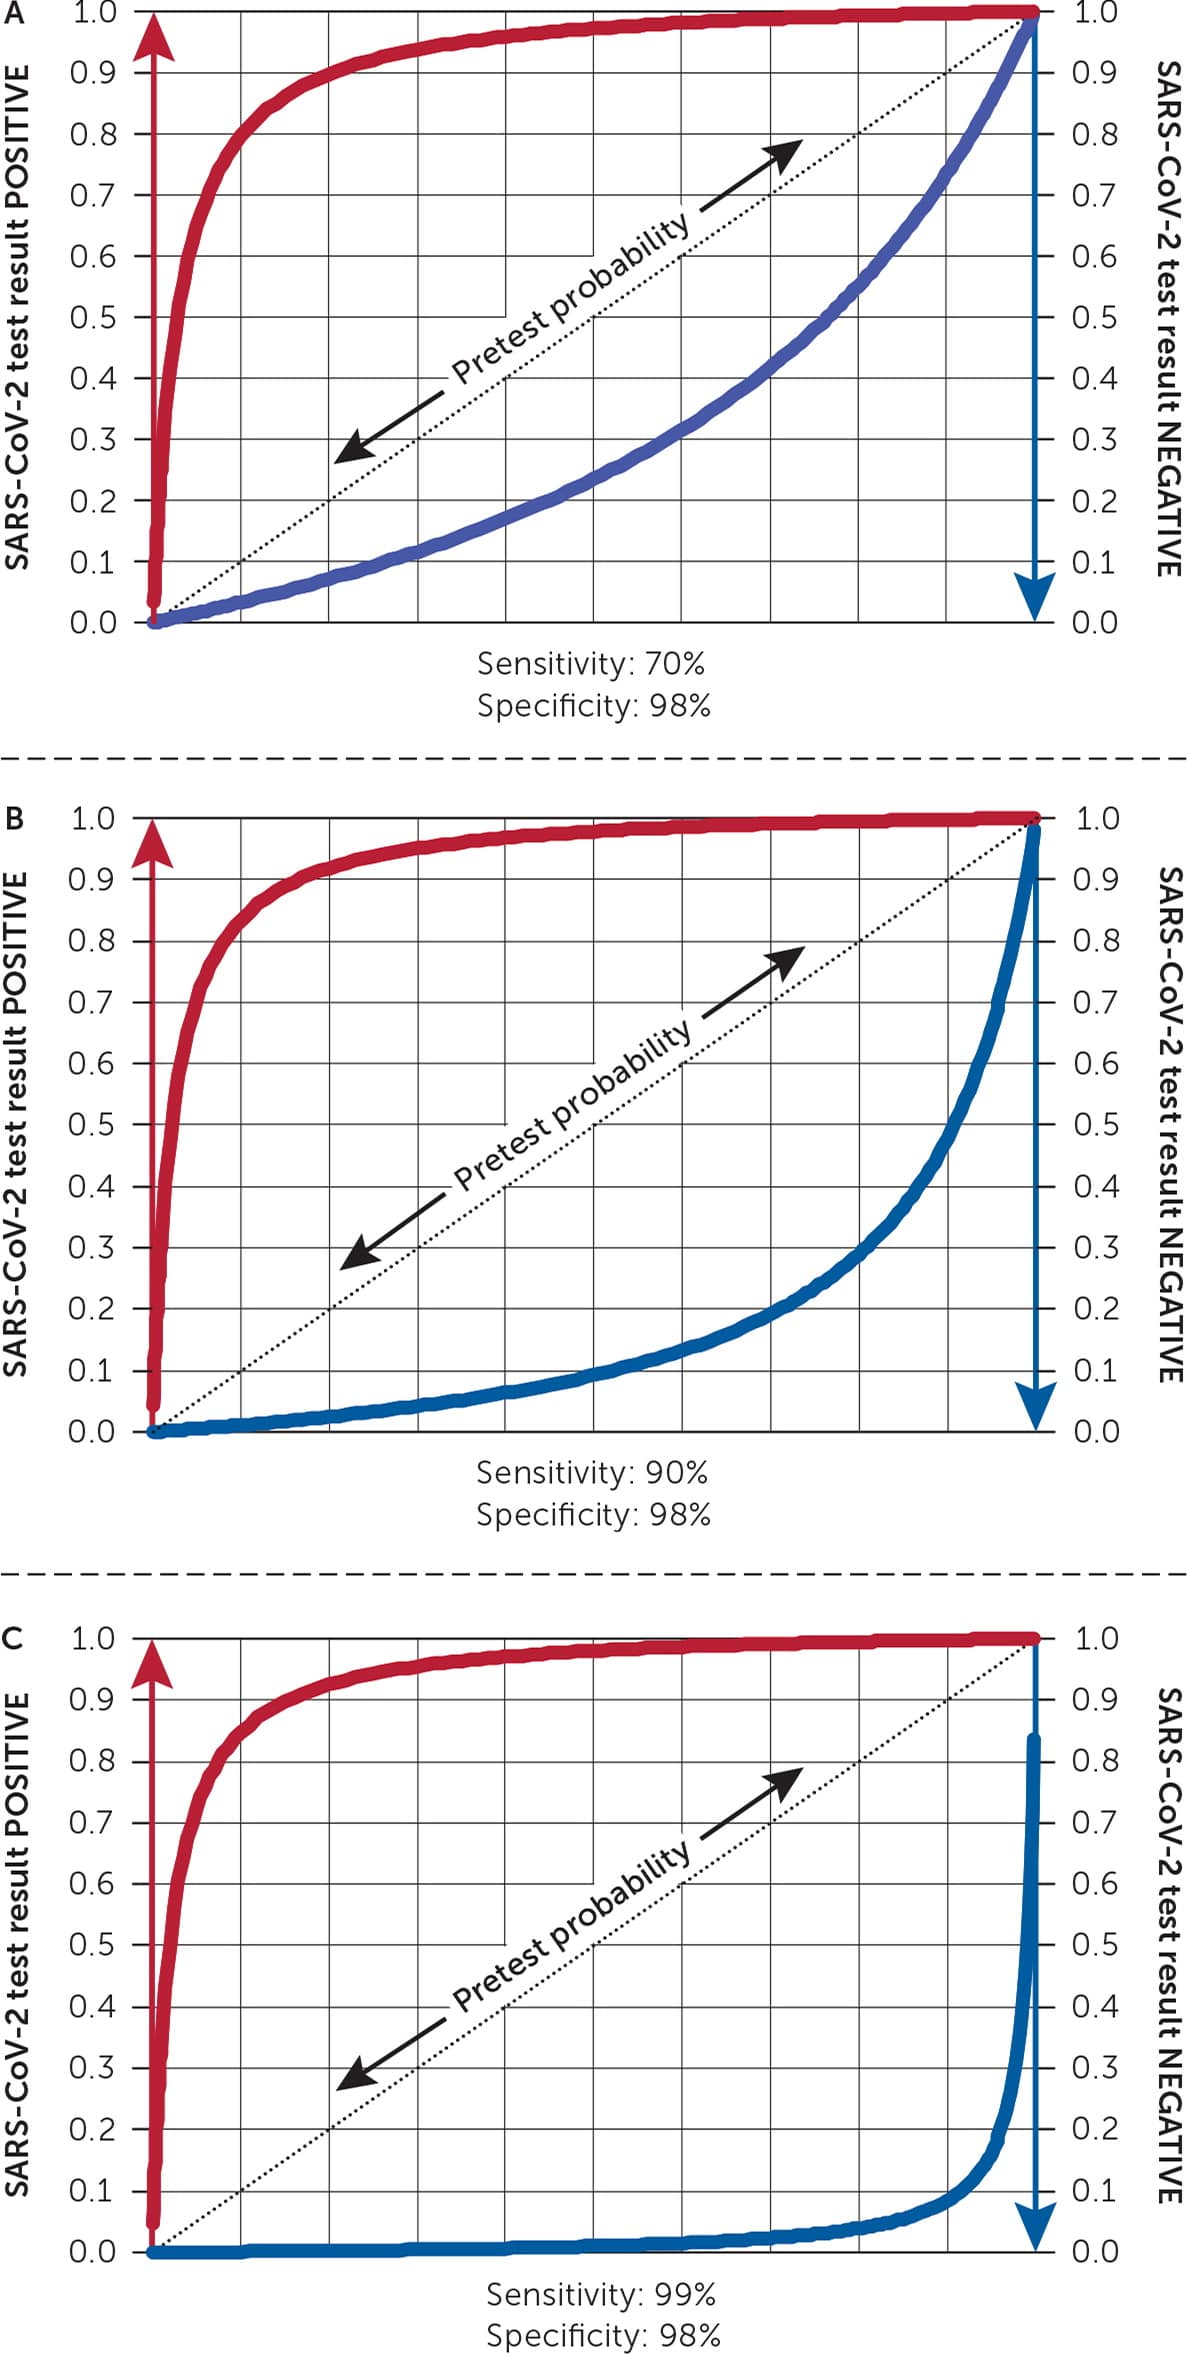
Three leaf plots with the same test specificity (98%) but different sensitivities: (A) 70%, (B) 90%, and (C) 99%. With a high pretest probability of disease, such as 80%, the posttest probability with a negative test result remains approximately 56%, 29%, and 4% with test sensitivities of 70%, 90%, and 99%, respectively. A negative test result should not rule out disease when pretest probability is high.
These graphs were created using a preprogrammed Excel spreadsheet downloaded from https://www.childhealthafrica.org/downloads.
What Should Be Considered with an Unexpected Negative Test Result?
A negative molecular or antigen test result might not rule out SARS-CoV-2 infection when pretest probability is high.13,25,27 Because false-negative results have implications for disease spread, clinicians should recommend isolation precautions despite a negative test result when pretest probability is high.
EVIDENCE SUMMARY
Figure 1 shows how the blue curve representing posttest probability with a negative test result progressively lowers with increasing test sensitivity. However, with a high pretest probability of disease, such as 80%, the posttest probability with a negative test result remains approximately 56%, 29%, and 4% with test sensitivities of 70%, 90%, and 99%, respectively. These observations show the need for highly sensitive SARS-CoV-2 diagnostic tests.
Although validation is needed, the Infectious Diseases Society of America suggests that clinicians repeat a SARS-CoV-2 diagnostic test 24 to 48 hours after a single negative molecular test result when pretest probability is high (e.g., symptomatic patient in a hospital setting).31 Instructions for antigen tests with FDA Emergency Use Authorization advise retesting with a molecular test after an initial negative antigen result when pretest probability is high.12 The Centers for Disease Control and Prevention recommends that this confirmatory molecular testing occur within 48 hours of the antigen test date.8
Is a Symptom- or Test-Based Approach Preferred for Discontinuing Isolation Precautions for Most Patients with COVID-19?
A symptom-based approach is preferred in most cases.32 RT-PCR detects viral RNA, whereas viral culture indicates presence of virus with replication ability and thus potential infectivity.21 RT-PCR detection of viral RNA does not necessarily correlate with infectivity. Although “prolonged positives” have been detected by RT-PCR for up to 12 weeks, SARS-CoV-2 has not been cultured more than 10 days after symptom onset in patients with mild to moderate COVID-19.1,21–23,33,34
EVIDENCE SUMMARY
A study of 193 symptomatic and 110 asymptomatic patients with SARS-CoV-2 infection found that viral RNA detection lasted a median of 17 to 19 days.35 Although viral load peaks near symptom onset and is similar between asymptomatic and symptomatic individuals, the probability of culturing SARS-CoV-2 from the upper respiratory tract decreases as time from symptom onset increases, falling to zero more than 10 days after symptom onset in patients with mild to moderate COVID-19.3,21,35 In addition to time after symptom onset, patients should have symptom improvement and no fever for 24 hours without antipyretics before discontinuing isolation.32
How Should Clinicians Counsel Patients about Serologic SARS-CoV-2 Test Results?
Current SARS-CoV-2 antibody tests detect IgM or IgG to viral spike or nucleocapsid proteins.11 Antibody tests may help identify past SARS-CoV-2 infection if performed two to four weeks after symptom onset.36,37 Antibody test results should not yet be used to infer immunity to SARS-CoV-2 infection or inform decisions to discontinue social distancing or use of face masks or personal protective equipment.37
EVIDENCE SUMMARY
A Cochrane review of 54 studies with 15,976 total samples (8,526 with known SARS-CoV-2 infection) from mostly hospitalized patients found that antibody tests may help confirm past SARS-CoV-2 infection in people who had symptoms more than two weeks before testing.36 However, the review found few data on the presence of antibodies beyond 35 days after symptom onset. If antibody testing is used, the Infectious Diseases Society of America suggests testing for SARS-CoV-2 IgG or total antibody levels three to four weeks after symptom onset.37 To assess prior infection in people vaccinated with the Pfizer-BioNTech, Moderna, or Janssen vaccine, an IgM or IgG test to the nucleocapsid protein should be selected because the vaccines encode for the spike protein.11 Because of current uncertainty about the extent and durability of natural and vaccine-induced immunity, antibody tests are not recommended to determine immune status at this time.9,11,37,38
Data Sources: A PubMed literature search was completed using the key words SARS-CoV-2 or COVID-19 or leaf plot with test, Cochrane, molecular, PCR, antigen, pretest probability, false negative, sensitivity, viral load, or viral culture. The U.S. Food and Drug Administration, Infectious Diseases Society of America, and Centers for Disease Control and Prevention websites were reviewed. Centers for Disease Control and Prevention sources were cross-referenced in PubMed. An Essential Evidence Plus summary on COVID-19 was reviewed. Search dates: September 17 to October 6, 2020; December 8 to 12, 2020; January 12, 2021; and February 14, 2021.