Evidence-based Medicine Toolkit
Evidence-based medicine (EBM) is judicious integration of the best available evidence with clinical expertise and an individual patient’s values, preferences, and unique circumstances. We ask authors to explicitly rate the strength of evidence for key recommendations on diagnosis and treatment whenever possible so readers will have a better understanding of the strength of the recommendations. Readers, in turn, should understand the ratings and the significant impact they can have on their practice. Information in this Toolkit is provided for readers who want to learn more about EBM, and for authors preparing manuscripts for publication seeking information about incorporating the principles of EBM in their manuscripts.
EBM Resources
I. Articles from American Family Physician
1. SERIES ON FINDING EVIDENCE AND PUTTING IT INTO PRACTICE
- Editorial: AFP’s Series on Finding Evidence and Putting It into Practice
- Keeping Up with the Medical Literature: How to Set Up a System
- How to Find Answers to Clinical Questions
- Diagnosis: Making the Best Use of Medical Data
- Finding High-Quality Review Articles
- Identifying and Using Good Practice Guidelines
2. Strength of Recommendation Taxonomy (SORT): A Patient-Centered Approach to Grading Evidence in the Medical Literature
Article from the February 1, 2004, issue of American Family Physician that describes the SORT evidence rating system, which allows authors to rate individual studies or bodies of evidence. To see examples of SORT tables, please look at any review article in AFP.
3. How to Write an Evidence-Based Clinical Review Article
Article from the January 15, 2002, issue of American Family Physician that presents guidelines for writing an evidence-based clinical review article. NOTE: American Family Physician no longer includes ratings of evidence in the text for individual studies as described in "How to Write an Evidence-Based Clinical Review Article." Instead, we use the SORT evidence rating system to rate bodies of evidence for key clinical recommendations on diagnosis and treatment.
4. Editorial: Evidence-based Medicine—Common Misconceptions, Barriers, and Practical Solutions
Editorial from September 15, 2018, issue of American Family Physician
II. Other Resources
1. WEBSITES FOR GENERAL PRINCIPLES OF EBM
Centre for Evidence-Based Medicine
Promotes evidence-based health care, and provides support and resources for the teaching and practice of evidence-based medicine.
Evidence-based Medicine Toolbox
Contains tools and resources for the teaching and practice of evidence-based medicine.
Grading of Recommendations Assessment, Development and Evaluation (GRADE) Working Group
Provides information about grading quality of evidence and strength of recommendations.
JAMAevidence
Provides a collection of EBM resources including textbooks, podcasts, education guides, and glossaries.
2. WEBSITES FOR SOURCES OF EVIDENCE-BASED CLINICAL INFORMATION
Free Access
McMaster University’s compendium of pre-appraised evidence to support clinical decisions. Content is presented in a hierarchical way, with the highest level of available evidence listed first.
Agency for Healthcare Research and Quality
In particular, see AHRQ’s Effective Healthcare Reports on various clinical topics.
Note: many of these reports are published in AFP under the “Implementing AHRQ Effective Health Care Reviews” department collection.
Cochrane Database of Systematic Reviews
Free for abstracts only, which in most cases provide the key findings of interest. The complete review requires a subscription. The Cochrane database contains systematic reviews of narrowly focused clinical questions (e.g., “Colchicine for treating acute gout attacks”) as opposed to broad, general reviews of topics (e.g., “Management of an acute gout attack”).
Note: AFP publishes summaries of Cochrane abstracts in “Cochrane for Clinicians.”
Repository of evidence-based clinical practice guidelines, appraised using the National Academy of Medicine’s Standards for Trustworthy Clinical Practice Guidelines.
National Center for Complementary and Integrative Health
Although NCCIH has been criticized for political interference and questionable science, we include it in this list because there are few freely available comprehensive sources of information in this field.
Trip (Turning Research Into Practice)
Contains links to a wide range of journal articles, medical organization clinical guidelines, online medical references, and other sources. A limited version is freely available; additional content requires an annual subscription.
U.S. Preventive Services Task Force
Premier source of evidence-based, graded recommendations for clinical preventive services.
Note: AFP publishes Recommendations and Reports from the USPSTF as well as CME case studies in the Putting Prevention Into Practice series.
Subscription Required
Most of these are point-of-care clinical information and decision support tools. These sites provide important background information, but authors should review the primary source to use as a citation for the article.
Essential Evidence Plus
Includes POEMS (collections of patient-oriented evidence that matters).
Database of dietary supplements, natural medicines, and complementary, alternative, and integrative therapies.
To ensure adequate searching on your topic, we strongly recommend that you review several of the above sources, in addition to a PubMed search of your topic. We recommend filtering your results from the main PubMed search results pages by selecting Systematic Review under Article Type. You can also try the built-in filters of the Clinical Queries search page.
Sample Data Sources paragraph:
Data Sources: A PubMed search was completed in Clinical Queries using the key terms gout and hyperuricemia. The search included meta-analyses, randomized controlled trials, clinical trials, and reviews. Also searched were the Agency for Healthcare Research and Quality Effective Healthcare Reports, the Cochrane database, DynaMed, and Essential Evidence Plus. November 18, 2017.
3. EBM CALCULATORS
MEDICAL CALCULATORS
AFP has partnered with MDCalc as the resource for clinical calculators, such as the Centor Score (Modified/McIsaac) for Strep Pharyngitis, the CHA₂DS₂-VASc Score for Atrial Fibrillation Stroke Risk, the Revised Cardiac Risk Index for Pre-Operative Risk, and the Wells' Criteria for Pulmonary Embolism. MDCalc is available online and via smartphone app at MDCalc Medical Calculator.
The following online calculators perform statistical calculations, such as number needed to treat, odds/probability converter, positive and negative likelihood ratios, positive and negative predictive values, and posttest probability.
ClinCalc (free)
Relative risk or risk ratio from an odds ratio
Number needed to treat
EBM Toolbox (free)
Diagnostic test calculator (sensitivity, specificity, positive and negative likelihood ratios, positive and negative predictive values, post-test probability)
Randomized controlled trial calculator
Prospective study calculator
Case-control study calculator
Odds Ratio to NNT Converter
MedCalc (free)
Sensitivity, specificity, positive and negative likelihood ratios, positive and negative predictive values, post-test probability.
SORT: Rating the Strength of Evidence
American Family Physician and other family medicine journals use the Strength of Recommendation Taxonomy (SORT) system for rating bodies of evidence for key clinical recommendations. (For additional background, please see Strength of Recommendation Taxonomy (SORT): A Patient-Centered Approach to Grading Evidence in the Medical Literature, an explanatory article published in the February 1, 2004, issue of AFP), as well as this guidance for rating the strength of evidence.
The SORT table is intended to highlight the most important three to seven recommendations for clinicians from a review article. Each recommendation is accompanied by a SORT rating of A, B, or C as defined below to emphasize interventions and approaches that improve patient-oriented outcomes (e.g. morbidity, mortality, quality of life) over disease-oriented evidence (e.g. biomarkers, surrogate endpoints). More details about creating a SORT table can be found in the Authors Guide.
| STRENGTH OF RECOMMENDATION |
DEFINITION |
|---|---|
| A | Recommendation based on consistent and good quality patient-oriented evidence.* |
| B | Recommendation based on inconsistent or limited quality patient-oriented evidence.* |
| C | Recommendation based on consensus, usual practice, expert opinion, disease-oriented evidence,** and case series for studies of diagnosis, treatment, prevention, or screening |
| * Patient-oriented evidence measures outcomes that matter to patients: morbidity, mortality, symptom improvement, cost reduction, quality of life. ** Disease-oriented evidence measures intermediate, physiologic, or surrogate endpoints that may or may not reflect improvements in patient outcomes (e.g., blood pressure, blood chemistry, physiological function, and pathological findings). |
|
EBM Features and Departments
American Family Physician publishes a number of evidence-based medicine (EBM) features and departments in every issue, some of which include the following:
- Review Articles with Strength of Evidence ratings
- Clinical Inquiries from the Family Physicians Inquiries Network - Bottom-line, evidence-based answers to key clinical quesitons.
- Cochrane for Clinicians - Concise summaries of Cochrane abstracts that answer a narrowly focused clinical question, along with practice pointers.
- Help Desk Answers from the Family Physicians Inquiries Network - Bottom-line, evidence-based answers to key clinical questions.
- Implementing AHRQ Effective Health Care Reviews - Evidence-based guidance on diagnosis and treatment of common clinical conditions.
- Medicine by the Numbers - Bottom-line guidance on interventions for common clinical conditions, along with the number needed to treat (NNT) in order for that intervention to be beneficial for one additional person.
- Point-of-Care Guides - Decision tools for diagnosis or treatment of common clinical conditions.
- POEMs–Patient-Oriented Evidence that Matters: Department Collection - Concise summaries of individual studies reporting on interventions that improve a patient’s morbidity, mortality, or quality of life.
- POEMs–Patient-Oriented Evidence that Matters: Top POEMs - The top 20 POEMS of previous years and the top POEMS consistent with the principles of the Choosing Wisely campaign.
- Practice Guidelines - Concise summaries of practice guidelines from major medical organizations and governmental agencies.
- Putting Prevention into Practice: An Evidence-Based Approach - Case studey quizzes based on clinical recommendtions from the USPSTF, and CME credit available.
- USPSTF Recommendations and Rationale Statements - Summaries of new and updated recommendations from the USPSTF.
EBM Glossaries
Note: See the AFP Journal Club Toolkit and MDCalc’s glossary of EBM terms for additional information on EBM terms and types of studies.
Select a Glossary:
- Statistical Terms and Concepts Used in Evidence-Based Medicine
- Evidence-Based Medicine Study Types
- Hill's Criteria for Causation
- Brief Definitions of Statistical Terms and EBM Concepts
Statistical Terms and Concepts Used in Evidence-Based Medicine
Search terms alphabetically:
Bias—Intentional and Unintentional
Unintentional bias is the result of using a weaker study design (e.g., a case series or observational study), not designing a study well (e.g., using too low a dose of the comparator drug), or not executing the study well (e.g., making it possible for participants or researchers to determine to which group they are assigned). Intentional bias also exists. Examples of study techniques that are designed to make a favorable result for the study drug more likely include a run-in phase using the active drug to identify compliant patients who tolerate the drug; per protocol rather than intention-to-treat analysis; and intentionally choosing too low a dose of the comparator drug or choosing an ineffective comparator drug.
Blinding (also known as Masking) and Allocation Concealment
Allocation concealment recently has been recognized as an important element of randomized controlled trial design. Allocation is concealed when neither the participants nor the researchers know or can predict to which group in a study (control or treatment) the patient is assigned. Allocation concealment takes place before the study begins, as patients are being assigned. Blinding or masking—concealing the study group assignment from those participating in the study—occurs after the study begins. Blinding should involve the patient, the physicians caring for the patient, and the researcher. It is particularly important that the persons assessing outcomes also are blinded to the patient’s study group assignment.
Clinical Decision Rules
Individual findings from the history and physical examination often are not helpful in making a diagnosis. Usually, the physician has to consider the results of several findings as the probability of disease is revised. Clinical decision rules help make this process more objective, accurate, and consistent by identifying the best predictors of disease and combining them in a simple way to rule in or rule out a given condition. Examples include the Strep Score, the Ottawa Ankle Rules, scores for ruling out pulmonary embolism, and a variety of clinical rules to evaluate perioperative risk. Also see this Point-of Care-Guide clinical decision rule table.
Clinical vs. Statistical Significance
In a large study, a small difference may be statistically significant but not necessarily clinically significant. For example, does a 1- or 2-point difference on a 100-point dementia scale matter to your patients? It is important to ask whether statistically significant differences also are clinically significant. Conversely, if a study finds no difference, it is important to ask whether it was large enough to detect a clinically important difference and if a difference actually existed. A study with too few patients is said to lack the power to detect a difference.
Confidence Intervals and P Values
The P value tells us how likely it is that the difference between groups occurred by chance rather than because of an effect of treatment. For example, if the absolute risk reduction was 4% with P = .04, if the study were done 100 times, a risk reduction this large would occur four times by chance alone. The confidence interval gives a range and is more clinically useful. A 95% confidence interval indicates that if the study were repeated 100 times, the study results would fall within this interval 95 times. For example, if a study found that a test was 80% specific with a 95% confidence interval of 74% to 85%, the specificity would fall between 74% and 85% 95 times if the study were repeated 100 times. In general, larger studies provide more precise estimates.
Disease-Oriented Evidence (or Outcomes)
Disease-oriented evidence refers to the outcomes of studies that measure physiologic or surrogate markers of health. This would include things such as blood pressure, serum creatinine, glycohemoglobin, sensitivity and specificity, or peak flow. Improvements in these outcomes do not always lead to improvements in patient-oriented outcomes such as symptoms, morbidity, quality of life, or mortality.
External and Internal Validity
External validity is the extent to which results of a study can be generalized to other persons in other settings, with various conditions, especially "real world" circumstances. Internal validity is the extent to which a study measures what it is supposed to measure, and to which the results of a study can be attributed to the intervention of interest, rather than a flaw in the research design. In other words, the degree to which one can draw valid conclusions about the causal effects of one variable or another.
Healthy Volunteer Bias
People who volunteer for a clinical trial are generally healthier and have more favorable outcomes than those who do not. For example, when comparing English women who volunteered for a mammography trial with those who did not, the volunteers had half the overall mortality of those who stayed home. This is especially important in observational (nonrandomized) studies, and may lead to better outcomes than expected in those who volunteer to participate or choose to take a medicine or choose to exercise.
Intention-to-Treat Analysis
Were the participants analyzed in the groups to which they were assigned originally? This addresses what happens to participants in a study. Some participants might drop out because of adverse effects, have a change of therapy or receive additional therapy, move out of town, leave the study for a variety of reasons, or die. To minimize the possibility of bias in favor of either treatment, researchers should analyze participants based on their original treatment assignment regardless of what happens afterward. The intention-to-treat approach is conservative; if there is still a difference, the result is stronger and more likely to be because of the treatment. Per protocol analysis, which only analyzes the results for participants who complete the study, is more likely to be biased in favor of the active treatment.
Lead Time Bias
When one screens for cancer, one will always detect cancers earlier. However, screening is only beneficial if the overall length of life increases, not just the time from diagnosis. Lead time is the time between detection of disease due to screening and when it would ordinarily be detected due to signs or symptoms. Lead time bias represents the apparent benefit that screening might seem to provide, but which actually just represents a longer duration of known disease, but no increase in actual lifespan. For a graphic representation of lead time bias, see figure 2 in Screening for Cancer: Concepts and Controversies.
Length Time Bias
In a study of cancer screening, a screening test is more likely to identify slower growing tumors than fast growing tumors, which may appear between screening intervals. In an observational study comparing screened with unscreened patients, this will make the outcomes appear better in the screening group, because the cancers detected have a more favorable prognosis. For a graphic representation of length time bias, see figure 3 in Screening for Cancer: Concepts and Controversies.
Likelihood Ratios
Likelihood ratios (LRs) correspond to the clinical impression of how well a test rules in or rules out a given disease. A test with a single cutoff for abnormal will have two LRs, one for a positive test (LR+) and one for a negative test (LR–). Tests with multiple cutoffs (i.e., very low, low, normal, high, very high) can have a different LR for each range of results. A test with an LR of 1.0 indicates that it does not change the probability of disease. The higher above 1 the LR is, the better it rules in disease (an LR greater than 10 is considered good). Conversely, the lower the LR is below 1, the better the test result rules out disease (an LR less than 0.1 is considered good).
Note: for additional information about likelihood ratios, see this comprehensive handout.
Low Value Care
The Choosing Wisely campaign has highlighted what it describes as low value care. That is, care which costs money and may even be harmful, but has not been shown to improve health outcomes in a clinically meaningful way compared with less costly or less potentially harmful alternatives. For example, screening EKGs in patients at low risk of coronary artery disease does not improve outcomes or cardiovascular risk prediction over traditional risk factors.
Network Meta-Analysis
A network meta-analysis (also known as a multiple-treatments meta-analysis) allows you to compare treatments directly (for example, head-to-head trials) and indirectly (for example, against a first-line treatment). This increases the number of comparisons available and may allow the development of decision tools for effective treatment prioritization.
Non-inferiority trial
In the past, most randomized trials were designed to prove that one intervention was more effective than another. Non-inferiority trials are designed to prove that a (usually new) intervention is not significantly worse than another. It is important to carefully examine the assumptions about what is significantly worse and what is not.
Number Needed to Treat/Number Needed to Harm
The absolute risk reduction (ARR) can be used to calculate the number needed to treat, which is … number of patients who need to be treated to prevent one additional bad outcome. For example, if the annual mortality is 20% in the control group and 10% in the treatment group, then the ARR is 10% (20 – 10), and the number needed to treat is 100% ÷ ARR (100 ÷ 10) = 10 per year. That is, for every 10 patients who are treated for one year, one additional death is prevented. The same calculation can be made for harmful events. The number of patients who need to receive an intervention instead of the alternative for one additional patient to experience an adverse event. The NNH is calculated as: 1/ARI, where ARI is absolute risk increase (see NNT). For example, if a drug causes serious bleeding in 2% of patients in the treatment group over one year compared with 1% in the control group, the number needed to treat to harm is 100% ÷ (2% – 1%) = 100 per one year. The absolute increase (ARI) is 1%.
Observational vs. Experimental Studies
In an observational study of a drug or other treatment, the patient chooses whether or not to take the drug or to have the surgery being studied. This may introduce unintentional bias. For example, patients who choose to take hormone therapy probably are different from those who do not. Experimental studies, most commonly randomized controlled trials (RCTs), avoid this bias by randomly assigning patients to groups. The only difference between groups in a well-designed RCT is the treatment intervention, so it is more likely that differences between groups are caused by the treatment. When good observational studies disagree with good RCTs, the RCT should be trusted.
Odds Ratios and Relative Risk
Observational studies usually report their results as odds ratios or relative risks. Both are measures of the size of an association between an exposure (e.g., smoking, use of a medication) and a disease or death. A relative risk of 1.0 indicates that the exposure does not change the risk of disease. A relative risk of 1.75 indicates that patients with the exposure are 1.75 times more likely to develop the disease or have a 75% higher risk of disease. Odds ratios are a way to estimate relative risks in case-control studies, when the relative risks cannot be calculated specifically. Although it is accurate when the disease is rare, the approximation is not as good when the disease is common.
Overdiagnosis
Overdiagnosis occurs when a screening test detects a condition that is typically treated, but that in this case never would have become clinically apparent or caused symptoms. For example, screening with PSA often detects prostate cancers that are treated, but that never would have progressed to cause symptoms prior to death from another cause. For a graphic representation of overdiagnosis bias, see figure 4 in Screening for Cancer: Concepts and Controversies.
Overtreatment
Overtreatment refers to treating when it is not indicated, or treating more aggressively than is warranted. For example, targeting a blood pressure of 120/80 in an average risk person or using antibiotics for acute bronchitis.
Patient-Oriented Evidence
Patient-oriented evidence (POE) refers to outcomes of studies that measure things a patient would care about, such as improvement in symptoms, morbidity, quality of life, cost, length of stay, or mortality. Essentially, POE indicates whether use of the treatment or test in question helped a patient live a longer or better life. Any POE that would change practice is a POEM (patient-oriented evidence that matters).
Permuted Block Randomization
Simple randomization does not guarantee balance in numbers during a trial. If patient characteristics change with time, early imbalances cannot be corrected. Permuted block randomization ensures balance over time. The basic idea is to randomize each block such that m patients are allocated to A and m to B.
Positive and Negative Predictive Value
Predictive values help interpret the results of tests in the clinical setting. The positive predictive value (PV+) is the percentage of patients with a positive or abnormal test who have the disease in question. The negative predictive value (PV–) is the percentage of patients with a negative or normal test who do not have the disease in question. Although the sensitivity and specificity of a test do not change as the overall likelihood of disease changes in a population, the predictive value does change. For example, the PV+ increases as the overall probability of disease increases, so a test that has a PV+ of 30% when disease is rare may have a PV+ of 90% when it is common. Similarly, the PV changes with a physician’s clinical suspicion that a disease is or is not present in a given patient.
Pretest and Post-test Probability
Whenever an illness is suspected, physicians should begin with an estimate of how likely it is that the patient has the disease. This estimate is the pretest probability. After the patient has been interviewed and examined, the results of the clinical examination are used to revise this probability upward or downward to determine the post-test probability. Although usually implicit, this process can be made more explicit using results from epidemiologic studies, knowledge of the accuracy of tests, and Bayes’ theorem. The post-test probability from the clinical examination then becomes the starting point when ordering diagnostic tests or imaging studies and becomes a new pretest probability. After the results are reviewed, the probability of disease is revised again to determine the final post-test probability of disease.
Receiver Operating Characteristic Curves
A receiver operating characteristic (ROC) curve plots the true positive rate (percent of patients with disease who have a positive test) against the false positive rate (percent without disease who have a positive test) as one varies the cutoff for what defines a positive test. The area under this curve is 1.0 for a perfectly accurate test, and 0.5 for a useless test, with higher values representing more accurate tests. The area under the ROC curve also corresponds to the likelihood that the test will correctly classify two randomly selected people correctly, one with and one without disease. The ROC curve below is for vaginal ultrasound as a test for uterine cancer, using different cutoffs for endometrial wall thickness as abnormal.
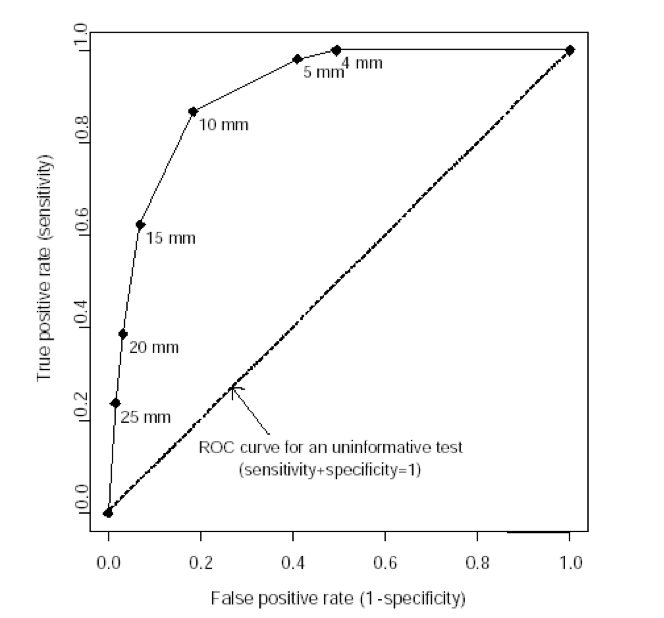
Note: the “mm” values in this graph represent endometrial wall thickness, as observed on ultrasound.
Relative and Absolute Risk Reduction
Studies often use relative risk reduction to describe results. For example, if mortality is 20% in the control group and 10% in the treatment group, there is a 50% relative risk reduction ([20 – 10] ÷ 20) x 100%. However, if mortality is 2% in the control group and 1% in the treatment group, this also indicates a 50% relative risk reduction, although it is a different clinical scenario. Absolute risk reduction subtracts the event rates in the control and treatment groups. In the first example, the absolute risk reduction is 10%, and in the second example it is 1%. Reporting absolute risk reduction is a less dramatic but more clinically meaningful way to convey results.
Run-in Period
A run-in period is a brief period at the beginning of a trial before the intervention is applied. In some cases, run-in periods are appropriate (for example, to wean patients from a previously prescribed medication). However, run-in periods to assess compliance and ensure treatment responsiveness create a bias in favor of the treatment and reduce generalizability.
Sample Size
The number of patients in a study, called the sample size, determines how precisely a research question can be answered. There are two potential problems related to sample size. A large study can give a precise estimate of effect and find small differences between groups that are statistically significant, but that may not be clinically meaningful. On the other hand, a small study might not find a difference between groups (even though such a difference may actually exist and may be clinically meaningful) because it lacks statistical power. The “power” of a study takes various factors into consideration, such as sample size, to estimate the likelihood that the study will detect true differences between two groups.
Sensitivity and Specificity
Sensitivity is the percentage of patients with a disease who have a positive test for the disease in question. Specificity is the percentage of patients without the disease who have a negative test. Because it is unknown if the patient has the disease when the tests are ordered, sensitivity and specificity are of limited value. They are most valuable when very high (greater than 95%). A highly Sensitive test that is Negative tends to rule Out the disease (SnNOut), and a highly Specific test that is Positive tends to rule In the disease (SpPIn).
Standardized Mean Difference
Also known as Cohen’s d, the standardized mean difference (SMD) is used to combine the results from studies using scales that have different lengths or sizes but are attempting to measure the same underlying parameter. For example, the 30-point Mini-Mental State Examination score and the 72-point Alzheimer’s Disease Assessment Scale–cog score are both measures of the severity of cognitive impairment. The SMD is calculated as the difference in the mean outcome between groups divided by the standard deviation. In general, an SMD less than 0.2 is not clinically significant, an SMD of 0.2 represents a small clinical effect, an SMD of 0.5 is a moderate effect, and an SMD of 0.8 or greater is a large effect.
Systematic Reviews and Meta-Analyses
Often, there are many studies of varying quality and size that address a clinical question. Systematic reviews can help evaluate the studies by posing a focused clinical question, identifying every relevant study in the literature, evaluating the quality of these studies by using predetermined criteria, and answering the question based on the best available evidence. Meta-analyses combine data from different studies; this should be done only if the studies were of good quality and were reasonably homogeneous (i.e., most had generally similar characteristics).
Visual Analog Scale
A visual analog scale asks participants to rate pain or some other subjective outcome on a scale, typically ranging from 0 to 100 points, where 0 is no pain and 100 is the worst possible pain imaginable. A difference of at least 10 points is the smallest change that is clinically noticeable or significant. Smaller differences may be statistically significant but are unlikely to be noticeable by patients.
Evidence-Based Medicine Study Types
Type of Study: Treatment
Studies of treatments, whether the treatment is a drug, device, or other intervention, must be randomized controlled trials. Because most new, relevant medical information involves advances in treatment, these studies must sustain rigorous review.
Validity questions
- Was it a controlled trial and were the patients randomly assigned? Studies not meeting both criteria are not reviewed.
- Are the patients in the study so dissimilar to typical primary care patients that the results will not apply? Studies performed on patients enrolled in settings markedly different from primary care will not be reviewed.
- Were steps taken to conceal the treatment assignment from personnel entering patients into the study? “Concealed allocation” through the use of opaque envelopes, centralized randomization, or other methods prevents selective enrollment of patients into a study. It is not the same as masking (blinding), which occurs after the study begins. The primary concern is about who will be enrolling patients. While the investigators are enrolling patients before the trial starts, they should make sure patients do not know to which group they will be allocated. This knowledge might introduce bias and affect how patients are enrolled. Concealed allocation generally will be noted in POEMs reviews but not in Evidence-Based Practice. If the allocation concealment is unclear, the study will be included unless there is a good chance that unconcealed allocation could produce a systematic bias (e.g., when popular opinion favors one treatment over another or when a skewed distribution of disease severity may affect the study outcome).
- Were all patients who entered the trial properly accounted for at its conclusion? Follow-up of patients entering the trial will be assessed. Studies with incomplete follow-up or large dropout rates (more than 20 percent) will not be reviewed.
Type of Study: Diagnosis
Studies of diagnostic tests, whether in a laboratory or as part of the physical examination, must demonstrate that the test is accurate at identifying the disease when it is present, that the test does not identify the disease when it is not present, and that it works well over a wide spectrum of patients with and without the disease.
Validity questions
- What is the disease being addressed? Studies evaluating a diagnostic test that identify an abnormality but not a disease generally are not reviewed.
- Is the test compared with an acceptable “gold standard”? The characteristics of the new test should be compared with the best available method for identifying the disease.
- Were both tests applied in a uniformly blind manner? This question determines that every patient received both tests, and that one test was not performed with knowledge of the results of the other test, which could introduce bias.
- Is the new test reasonable? Studies that evaluate diagnostic tests that cannot be implemented readily by primary care physicians will not be reviewed.
- What is the prevalence of disease in the study population? The prevalence of disease in the study population will be reported so that readers can compare it with their own practice.
- What are the test characteristics? The sensitivity, specificity, predictive values, and likelihood ratios will be reported. These values will be calculated from data in the study if they are not reported by the authors.
Type of Study: Systematic Reviews
Only systematic reviews (overviews), including meta-analyses, will be considered.
Validity questions
- Were the methods used to locate relevant studies comprehensive and clearly stated? Reviews not stating the method of locating studies will not be reviewed.
- Were explicit methods used to select studies to include in the overview? Reviews not stating methods of including or excluding studies will not be reviewed.
- Was the validity of the original studies included in the overview appropriately assessed? Reviews not stating the method used to assess the validity of the original studies will not be reviewed. Reviews can include or exclude studies based on quality scores. Reviews including all studies irrespective of their quality scores should present the validity evaluation; reviews eliminating studies based on low quality should describe explicitly how these studies were eliminated.
- Was the assessment of the relevance and validity of the original studies reproducible and free from bias? Published methods of assessing relevance or validity of others can be referenced or new criteria can be described. Generally, validity assessment should be performed independently by at least two investigators.
- Was variation between the results of the relevant studies analyzed? Heterogeneity in study results should be evaluated and, if present, explained.
- Were the results combined appropriately? When results from different studies are combined, only similar outcomes should be combined. Reviews that attempt to convert study results from one scale to another generally will not be considered.
Type of Study: Prognosis
The main threats to studies of prognosis are initial patient identification and loss of follow-up. Only prognosis studies that identify patients before they have the outcome of importance and follow up with at least 80 percent of patients are included.
Validity questions
- Was an “inception cohort” assembled? Did the investigators identify a specific group and follow it forward in time? Studies that do not meet these criteria or assemble an “inception cohort” or follow a specific group forward are not reviewed.
- Were the criteria for entry into the study objective and reasonable? Entry criteria must be reproducible and not too restrictive or too broad.
- Was group follow-up adequate (at least 80 percent)?
- Were the patients similar to those in primary care in terms of age, sex, race, severity of disease, and other factors that might influence the course of the disease?
- Where did the patients come from—was the referral pattern specified? The source of patients will be noted in the review.
- Were outcomes assessed objectively and blindly?
Decision Analysis
Decision analysis involves choosing an action after formally and logically weighing the risks and benefits of the alternatives. Although all clinical decisions are made under conditions of uncertainty, this uncertainty decreases when the medical literature includes directly relevant, valid evidence. When the published evidence is scant, or less valid, uncertainty increases. Decision analysis allows physicians to compare the expected consequences of pursuing different strategies under conditions of uncertainty. In a sense, decision analysis is an attempt to construct POEMs artificially out of disease-oriented evidence.
Validity questions
- Were all important strategies and outcomes included? Analyses evaluating only some outcomes or strategies will not be reviewed.
- Was an explicit and sensible process used to identify, select, and combine the evidence into probabilities? Is the evidence strong enough?
- Were the utilities obtained in an explicit and sensible way from credible sources? Specifically, were utilities obtained from small samples or from groups not afflicted with the disease or outcome.
- Was the potential impact of any uncertainty in the evidence determined? It must be noted whether a sensitivity analysis was performed to determine how robust the analysis is under different conditions.
- How strong is the evidence used in the analysis? Could the uncertainty in the evidence change the result? It will be noted if any given variable unduly influences the analysis.
Qualitative Research
Qualitative research uses nonquantitative methods to answer questions. While this type of research is able to investigate questions that quantitative research cannot, it is at risk for bias and error on the part of the researcher. Qualitative research findings will be reported if they are highly relevant, although specific conclusions will not be drawn from the results.
Validity questions
- Was the appropriate method used to answer the question? Interviews or focus groups should be used to study perceptions. Observation is required to evaluate behaviors. Studies not using the appropriate method will not be reviewed.
- Was appropriate and adequate sampling used to get the best information? Random sampling is not used in qualitative research. Instead, patients are selected with the idea that they are best suited to provide appropriate information. Assurance that enough patients were studied to provide sufficient information should be found in the description.
- Was an iterative process of collecting information used? In qualitative research, the researcher learns about the topic as the research progresses. The study design should consist of data collection and analysis, followed by more data collection and analysis, in an iterative fashion, until no more information is obtained.
- Was a thorough analysis presented? A good qualitative study presents the findings and provides a thorough analysis of the data.
- Are the background and training of the investigators described? Because investigators are being relied on for analysis of the data, their training and biases must be documented. These characteristics can be used to evaluate the conclusions.
Hill's Criteria for Causation
These are a broadly accepted set of nine criteria to establish causality between an exposure or incidence and an effect or consequence. In general, the more criteria that are met, the more likely the relationship is causal.
- Strength of association: larger associations are more likely to be causal
- Consistency of association: repeated observations of the association across different samples and situations
- Specificity: the absence of other likely explanations or causes
- Temporal relationship: the effect must occur after the cause
- Biological gradient (dose-response relationship): higher exposure increases likelihood of the effect
- Plausibility: a physiologic or biologic mechanism exists to explain the relationship (limited by current state of knowledge)
- Coherence: laboratory and epidemiologic relationships are congruent
- Experiment: investigational experiments reproduce effects
- Analogy: similar factors are known to have similar effects
Information from Hill AB. The environment and disease: association or causation? Proc R Soc Med. 1965;58(5):295-300.
Brief Definitions of Statistical Terms and EBM Concepts
| TERM | ABBREVIATION | DEFINITION |
|---|---|---|
| Sensitivity | Sn | Percentage of patients with disease who have a positive test for the disease in question |
| Specificity | Sp | Percentage of patients without disease who have a negative test for the disease in question |
| Predictive value (positive and negative) | PV+ PV- |
Percentage of patients with a positive or negative test for a disease who do or do not have the disease in question |
| Pretest probability |
Probability of disease before a test is performed | |
| Post-test probability |
Probability of disease after a test is performed | |
| Likelihood ratio | LR | LR >1 indicates an increased likelihood of disease LR <1 indicates a decreased likelihood of disease. The most helpful tests generally have a ratio of less than 0.2 or greater than 5. |
| Relative risk reduction | RRR | The percentage difference in risk or outcomes between treatment and control groups. Example: if mortality is 30% in controls and 20% with treatment, RRR is (30-20)/30 = 33 percent. |
| Absolute risk reduction | ARR | The arithmetic difference in risk or outcomes between treatment and control groups. Example: if mortality is 30% in controls and 20% with treatment, ARR is 30-20=10%. |
| Number needed to treat | NNT | The number of patients who need to receive an intervention instead of the alternative in order for one additional patient to benefit. The NNT is calculated as: 1/ARR. Example: if the ARR is 4%, the NNT = 1/4% = 1/0.04 = 25. |
| 95 percent confidence interval | 95% CI | An estimate of certainty. It is 95% certain that the true value lies within the given range. A narrow CI is good. A CI that spans 1.0 calls into question the validity of the result. |
| Systematic review | A type of review article that uses explicit methods to comprehensively analyze and qualitatively synthesize information from multiple studies | |
| Meta-analysis | A type of systematic review that uses rigorous statistical methods to quantitatively synthesize the results of multiple similar studies |
AFP Journal Club Toolkit
The following are “evidence-based medicine pointers” for analyzing research studies, culled from AFP’s Journal Club series, which ran from November 1, 2007, through May 15, 2015.
There are two major sections: Types of Studies and Key Concepts When Looking at Research Studies, organized as shown below. Within each section, key words are listed in bold.
Note: See also the EBM Glossaries and MDCalc's glossary of EBM terms for additional explanation of terms, studies, and statistical concepts.
TYPES OF STUDIES:
- Clinical Decision Rules
- Clinical Guidelines
- Meta-Analyses
- Randomized Controlled Trials
- Retrospective Studies
KEY CONCEPTS WHEN LOOKING AT RESEARCH STUDIES:
- Bias
- Causation
- Industry "Spin"
- NNT and NNH
- Noninferiority
- Odds Ratio/Relative Risk
- Patient-Oriented Evidence vs. Disease-Oriented Evidence
- Statistical Significance vs. Clinical Significance
- Study Interpretation
- True and False-Positive/Negative Study Results
- Types of Study Analysis
TYPES OF STUDIES
CLINICAL DECISION RULES
- Clinical decision rules need to go through a rigorous process of derivation, internal validation, and external validation before widespread adoption.
- A hierarchy exists for clinical decision rules. No clinical decision rule should be widely used until it has been clearly shown to be beneficial in external validity studies.
CLINICAL GUIDELINES
- Primary care guidelines tend to be more methodologically sound than specialty society guidelines.
- The level of evidence of clinical guidelines should be reviewed before widespread implementation.
- Clinical trials should be designed to have only one predesignated primary outcome. Studies with multiple outcomes run the risk that a statistically significant outcome occurred by chance alone.
- Secondary outcomes should be used only to generate thoughts/ideas/hypotheses for future studies. Otherwise, they might give a false sense of an intervention’s efficacy.
META-ANALYSES
- A good meta-analysis requires the following (among other things): an analysis of the quality of studies included in the meta-analysis (one set of criteria is published by the Cochrane Collaboration); and data extraction by more than one person in each study (do the reviewers agree on something as basic as the data to be analyzed?).
- A multiple-treatments meta-analysis allows you to compare treatments directly (e.g., head-to-head trials) and indirectly (e.g., against a first-line treatment). This increases the number of comparisons available and may allow the development of decision tools for effective treatment prioritization.
- Similar to other meta-analyses, a multiple-treatments meta-analysis can be limited by low numbers of patients and poorly designed or heterogeneous studies (the “garbage-in, garbage-out” phenomenon).
- Meta-analyses can come to the wrong conclusion for several reasons. First is publication bias—typically only positive trials are published and included in the meta-analysis. The second is the garbage-in, garbage-out phenomenon; to avoid this, the authors of a meta-analysis must evaluate the quality of the trials they are using so that only higher-quality studies are included.
RANDOMIZED CONTROLLED TRIALS
- Randomized controlled trials should meet the following criteria: they should provide an appropriate description of randomization; they should be double blind; and they should provide a description of withdrawals and dropouts.
- A study using block randomization assigns patients in small groups. This type of randomization is done to decrease the likelihood of too many patients being randomized to a single treatment. In one study, randomization was in blocks of four, so one person in each block was randomized to one of the four treatment protocols.
- Because of ethical constraints, randomized controlled trials will not be available to answer all clinical questions, particularly those that explore long-term risks, such as cancer. For these types of clinical questions, we must rely on mathematical modeling or abstraction of data from other sources.
RETROSPECTIVE STUDIES
- Retrospective studies are generally suspect because they must rely on complete and accurate medical record documentation, which usually is lacking.
- Retrospective studies need to follow common, agreed-upon methods of data abstraction.
- Propensity matching is used to remove confounders in retrospective studies. The idea is to balance the groups being compared in their likelihood of needing a therapy.
KEY CONCEPTS WHEN LOOKING AT RESEARCH STUDIES
BIAS
- Confounding variables bias. These are characteristics that are distributed differently among study groups and that can affect the outcome being assessed.
- Exclusion bias. Excluding patients in whom the study drug has already failed biases the study in favor of that drug. If these patients had been included (e.g., a random sample of patients), the response rate to the study drug would have been less than observed.
- History bias. Controlling for temporal trends in disease incidence is important when doing a comparison between contemporary and historical groups.
- Industry bias. This refers to the fact that studies and reviews published by industry are more likely to present positive (favorable) outcomes. Look for non–industry-sponsored studies—they are less likely to have publication bias or use inappropriate comparisons.
- Interrupted time series design bias. Studies with an interrupted time series design, also known as “before and after” studies, are subject to numerous potential confounders because of uncontrolled changes that occur in the study environment over time.
- Lack of placebo bias. Failure to use a true placebo may jeopardize the validity of the results of a trial. In one study, parents who got an empty syringe knew their child was not getting treatment and may have been biased toward a more negative interpretation when they answered follow-up questions regarding their child’s cough and sleep quality. Almost anything will look better than placebo. A study should compare the study drug with a real-world scenario, such as (in the case of another study) increasing the dose, switching antidepressants, or using another drug for augmentation.
- Lead-time bias is an important consideration when evaluating a screening intervention. Diagnosing disease earlier with a screening test can appear to prolong survival without actually changing outcomes. The only thing that changes is the period of time during which the patient is diagnosed with the disease, not the actual survival time.
- Observation bias (also known as the Hawthorne effect) occurs when individuals temporarily modify their behavior (and consequently change study outcomes) when they know they are being observed. Gains achieved during the study period often regress when the study ends.
- Open-label study bias occurs when patients’ or researchers’ knowledge of the condition or treatment can influence their judgment. An example is when a researcher is adjudicating an outcome, and knows which treatment group a patient was assigned to. A stronger study is blinded for patients, researchers, and, if used, evaluators.
- Publication bias. Studies that show treatments in a positive light are more likely to be submitted for publication. For example, the published studies on levalbuterol look good. But if you look at all of the studies submitted to the U.S. Food and Drug Administration, levalbuterol and albuterol are equivalent, and albuterol costs less. Negative studies are less likely to get published than positive studies, and this results in the overwhelmingly positive nature of the literature. Even when negative studies are published, they are less likely to receive the attention by the media and medical establishment that positive studies do. In addition, more and more information is being hidden in online supplemental protocol information or in appendices.
- Review bias occurs when the reader of a test (e.g., radiologist, electrocardiographer) knows the patient’s history. The history may change the way a test is read.
- Run-in bias. Run-in periods to assess compliance and ensure treatment responsiveness create a bias in favor of the treatment in question, and yield results in a patient population that will not be the same as in your patients. Thus, the results of these studies may not be generalizable.
- Sampling bias. Representative inclusion of all possible study participants helps to eliminate differences between groups so that more appropriate comparisons can be made. If only some subsets of patients are included (i.e., “sampled”), they are less likely to represent the general population.
- Selection bias occurs when the patients in a study are not representative of the patients you see in practice.
- Spectrum bias occurs when the group being studied is either sicker or not as sick as the patients you see in your practice. A diagnostic test can perform differently in dissimilar patient populations. You cannot apply a test standardized in an inpatient population to your outpatient population (or vice versa) and expect it to have the same sensitivity and specificity.
- Straw man comparison bias. In head-to-head treatment trials, watch out for the straw man comparison. For example, make sure that an article that evaluates treatments uses equipotent dosages of the drugs being compared. Obviously, if you use an adequate dose of a study drug and a suboptimal comparison, the study drug is going to win. In one study, the doses of prasugrel and clopidogrel were not equivalent. As a corollary, a placebo-controlled trial should not typically change your practice; any drug comparison should be against a known effective therapy, if one exists.
- Verification bias or workup bias exists when not everyone in a study gets the definitive, criterion standard test. This generally makes the new test look better because real cases of disease are missed when patients with a negative new test are sent home.
CAUSATION
- Causation vs. association. A risk factor and outcome are associated if they occur together. Case-control studies can suggest an association, but not causation. Causation is more difficult to establish and generally requires a prospective randomized study.
- Case-control studies may not be able to control for all patient variables. This is a potential source of error. A good example of this would be case-control studies that suggested that postmenopausal estrogen was cardioprotective. Subsequent randomized controlled trials proved that this is not the case.
- An association does not confer causation. But when multiple criteria are met (e.g., strength of association, consistency, specificity, temporality, dose-response relationship, biologic plausibility, coherence, experimental evidence, analogy), the likelihood of a causal relationship increases.
- Hill’s criteria for causation (listed above) are a broadly accepted set of nine criteria to establish causality between an exposure or incidence and an effect or consequence. In general, the more criteria that are met, the more likely the relationship is causal.
- Reverse causation. A reverse causality error occurs when the outcome, or some component of it, causes the intervention or exposure in question. For example, in nonrandomized studies, participants may select their “intervention” behavior based on early symptoms or prior knowledge, which then may affect the outcome in question.
INDUSTRY “SPIN”
- Watch for “spins” promoted by pharmaceutical salespersons. Testimonials, isolated experiences, small company-sponsored studies with surrogate markers or “fuzzy” end points, and selected reprints are often used to try to convince physicians to use a certain drug or intervention.
- Be skeptical of industry-sponsored studies. These studies are often “spun” to favor the sponsor’s drug.
NNT AND NNH
- The number needed to treat (NNT), number needed to harm (NNH), and the magnitude of the benefit are critical information if you are going to make an educated decision about treatment options. NNT and NNH are powerful tools in documenting an intervention’s effect.
- Whenever you see an NNT, look for the corresponding NNH.
- Calculate NNT and NNH. They tell you the real magnitude of benefit and harm. P values only tell you that there is a difference between two groups; this difference can be clinically meaningless. NNT gives a better sense of the strength of treatment effect.
- How to calculate NNT or NNH: 1/(absolute difference in treated vs. untreated patients). For example, if 5% of treated patients have a heart attack and 10% of untreated patients have a heart attack, the NNT calculation is 1/(0.10 − 0.05), equals 1/0.05, equals 100/5, equals 20. Ignoring percent signs, the calculation simplifies to 100/absolute difference, equals 100/10 − 5, equals 100/5, equals 20.
- Let your patients know the magnitude of benefit and risk in language that is easy for them to understand. For instance, in one study, 33 patients need to be treated for one year to prevent one hospitalization, at a risk of one in 41 patients developing pneumonia.
- Large numbers of patients are typically required to demonstrate a deleterious side effect of a drug or intervention (i.e., the NNH).
NONINFERIORITY
- Noninferiority trials are designed to show that an alternative treatment is not substantially worse than the standard intervention. They do not meet the same rigorous design and statistical format of traditional superiority trials.
- Showing that one drug is noninferior to another does not mean that these drugs are equivalent.
- Authors of noninferiority trials must declare a margin of how far outside the acceptable outcome the treatment can perform and still be considered noninferior to the standard treatment.
- The noninferiority margin allows researchers to choose their own benchmark for what is considered a clinically significant difference between two drugs. This can lead to a drug being called noninferior when other researchers not associated with the study would call it inferior.
- The efficacy of the standard treatment (for instance, warfarin) shown in the trials that established its efficacy must be preserved in any noninferiority trials. In a study comparing warfarin and rivaroxaban, time in therapeutic range was not within established norms for many of the patients—this would make warfarin perform worse and allow rivaroxaban to appear noninferior.
ODDS RATIO / RELATIVE RISK
- An odds ratio tells us the odds of an outcome in one group compared with another group, but does not give us the magnitude of this changed outcome. It is usually used in case-control studies and not in randomized trials, where relative risk and absolute risk are used instead.
- Case-control studies are not interventional studies and are retrospective, so we use odds ratio rather than relative risk as a measure of the association. Odds ratio is calculated by dividing the odds of disease in those who were exposed to a given factor by the odds of disease in those who were not exposed.
- Relative risk is the ratio of the probability of an event in an exposed population to the probability in an unexposed population. This calculation is useful in comparisons in which there is a low probability of the event occurring.
- Attributable risk is the difference in the rate of an event between an exposed population and an unexposed population. This is usually calculated in cohort studies.
PATIENT-ORIENTED EVIDENCE VS. DISEASE-ORIENTED EVIDENCE
- Remember the difference between disease-oriented evidence (DOE) and patient-oriented evidence that matters (POEMs).
- POEMs refers to clinical outcomes that mean something to patients (e.g., death, fracture, myocardial infarction). DOE is an indirect measure of a pathologic or physiologic process that may or may not correlate with clinical outcomes (such as changes in blood glucose, electrocardiogram abnormalities, carotid intima thickening). Family physicians should concentrate on POEMs because it has a direct influence on patients’ health.
- A lot of studies use surrogate markers as outcomes (e.g., fasting or postprandial blood glucose, FEV1). These are DOEs. What we care about are POEMs (e.g., stroke rates, myocardial infarction rates, quality of life). Be wary of DOEs; they are surrogate markers of disease and may or may not correlate with important clinical end points, such as morbidity and mortality. For example, in certain clinical situations, it is possible to lower blood pressure, but not help patients. It could even harm them.
- A study should change your practice only if it is applicable to your patient population (e.g., study patients presented to a family physician or the emergency department, not a subspecialist).
STATISTICAL SIGNIFICANCE VS. CLINICAL SIGNIFICANCE
- Recognize that end points can be statistically significant without being clinically significant (e.g., A1C difference of 0.08%). Another example: in one study, 23 mg of donepezil was statistically better than 10 mg, but only in one of three tests, and by only two points on a 100-point scale. This is clinically imperceptible, yet it will be touted as superior by pharmaceutical companies.
- When reviewing a study, you must know what the scale measures, whether the scale has been validated, and what change in the scale is actually clinically significant.
STUDY INTERPRETATION
- Absolute risk reduction quantifies the actual difference between two outcomes; this is what the physician should be interested in. Relative risk reduction demonstrates the change in outcome relative to a baseline or control; it will often exaggerate a benefit.
- Abstracts of articles should not be relied on when deciding whether a therapy is good, because they often have misleading information and conclusions. The data and conclusion in the abstract of an article may not be the same as the data in the paper. If you read only the abstract, you may be misled.
- Blinding is ensuring that participants, clinicians, and/or investigators do not know which participants are assigned to each study group. Using seemingly identical products (in terms of taste, appearance, odor, and even texture) with the same dosing regimen is a common practice to help achieve blinding.
- Clinical scoring systems should be externally validated (“road tested”) before widespread implementation.
- Dates of the study. Look at the dates that data were generated and not the date of publication. If the data are old, updates in technology and treatments may affect the outcomes.
- “Double-dummy” design is used when the two drugs being tested look different from each other, so that group assignment cannot be blinded. In a double-dummy design, there are matching placebos for both administered drugs (two “dummy” drugs) and every patient gets an active drug and a placebo.
- Durability of an intervention (i.e., the ability to provide sustained results) is an important concept when considering implementing the intervention based on a study’s results.
- Efficacy is how a test or drug performs in a study setting. Effectiveness is how it performs in the general population. Usually, results are better for efficacy than for effectiveness.
- External validity refers to the ability to generalize the results of a study to other settings. The demonstrated efficacy of a drug or intervention in a clinical trial may not translate to effectiveness in the community or in your particular practice. Check to see if the population in the study is similar to the population you see in your practice. For example, the average age of patients in a certain study was 77 years. These findings should only be generalized to younger patients with caution.
- Internal validity means you have evidence that what you did in the study (i.e., the treatment) caused what you observed (i.e., the outcome). Internal validity can be threatened by confounding variables.
- Kappa is a measure of interobserver reliability (e.g., the probability that two radiologists reading the same film will get the same answer beyond chance alone). It is generally scored as: 0 = no agreement; 0 to 0.2 = slight agreement; 0.2 to 0.4 = fair agreement; 0.4 to 0.6 = moderate agreement; 0.6 to 0.8 = substantial agreement; and 0.8 to 1.0 = almost perfect agreement. Although in such a study, which would be more or less methodologically sound, a better strategy would have been to have two readers read each film, then have a third party adjudicate if the first two readers disagreed. This is generally accepted methodology.
- Logistic regression attempts to control for confounders between the experimental groups or participants. However, it is at best inexact and cannot control for every potential confounder.
- Multiple comparisons. As the number of comparisons increases, it becomes more likely that the groups being compared will appear to differ in at least one attribute, if only by chance alone.
- Observational studies are not the best design for testing some hypotheses. If we really wanted to know how good electrocardiography is, for example, we would design a study in which initial electrocardiography was performed in the emergency department, followed by cardiac catheterization in all of the patients. This is the only way to get the true sensitivity and specificity of electrocardiography. Observational studies let things take their course without a prescribed, randomized intervention. This adds a lot of uncertainty to the data (in this hypothetical case) by not controlling the subsequent workup.
- Post hoc cutoff values are often selected to maximize the sensitivity and specificity of a test. The test may not perform as well in another group of patients. Receiver operating characteristic curves are used to figure out the cutoff values to achieve optimal sensitivity vs. specificity.
- Post-marketing monitoring is often required to find a difference in adverse outcomes that are associated with the drugs.
- Power of a study is the probability of finding a real difference when one exists, and is based on the minimum number of participants needed to show a difference, the size of the treatment effect desired, and a predetermined level of significance. When you have fewer events in a study than you expect, you need to increase the number of participants, not decrease it.
- Prevalence of a disease in a population changes the interpretation of a test (i.e., the positive and negative predictive values).
- Retraction Watch (http://www.retractionwatch.com) is a blog about retractions in the scientific literature. There is currently no database that catalogs retractions.
- Type II (falsely negative) errors often occur when a study is too small to find a real difference between two treatments. A type I error occurs when the study shows a difference when in fact there is none (falsely positive).
TRUE- AND FALSE-POSITIVE/NEGATIVE STUDY RESULTS
- All tests follow a Bayesian model. They are more likely to be true-positive in a sick patient and false-positive in a well patient.
- Sensitivity and specificity only tell part of the story. Always look at the false-positive and false-negative rates of a test.
- False-positive studies. How many patients who really don’t have the disease are you treating simply because the test was positive? One study showed that 42% of low-risk patients had a positive result on chest computed tomography, but no evidence of pulmonary embolism on any confirmatory test. If the chest computed tomography result had been accepted as valid, a significant number of these patients would have been needlessly exposed to anticoagulation.
- False-negative studies. How many patients with true disease are you missing and not treating because the test was negative?
TYPES OF STUDY ANALYSIS
- Intention-to-treat analysis. This type of analysis evaluates all patients in the group to which they were assigned, whether or not they completed the study. Thus, persons who didn’t tolerate a treatment, for example, are still analyzed in their original group. This reflects our real-world experience. Some of our patients are going to do badly or stop a medication. They still need to be included in our equation when we decide whether to use a drug. This gives a more realistic sense of the treatment’s effectiveness efficacy, and reduces bias that would otherwise make the treatment look better than it actually is. Make sure that a study protocol makes sense. Don’t assume that a study uses an appropriate dose or schedule of a drug.
- Per-protocol analysis allows the researcher to throw out any data from patients who don’t tolerate a drug (for example). So a per-protocol analysis may not reflect the kind of results we will see in our practice and typically overestimates the net benefit of an intervention. Avoid basing your clinical decisions on articles that use per-protocol analysis.
- Post hoc and subgroup analyses should only be used to generate a hypothesis (the derivation set). This hypothesis then needs to be tested in a separate randomized study (the validation set), and should not be used to show the harm or benefit of a therapy.
- Power analysis ensures that there are enough participants enrolled in a study to find a difference, if there is one. This avoids a type II error, which is when there are not enough participants to find a difference, producing a false-negative result.
- Sensitivity analysis excludes outliers, such as large, heavily weighted studies and studies of marginal quality, to check whether the results are the same.