In the article “Sudden Arrhythmia Death Syndrome: Importance of the Long QT Syndrome” (August 1, 2003, page 483) the figure legends for Figures 2 and 3 were inadvertently transposed. Figure 2 (on page 485) shows long QT intervals, whereas Figure 3 (on page 486) shows torsades de pointes. The figures are reprinted above with the correct legends. The online version of this article has been corrected.
FIGURE 2.
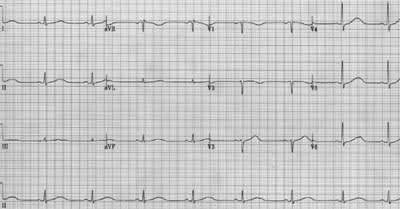
Long QT interval shown in all electrocardiographic leads. The interval is measured from the beginning of the QRS complex to the end of the T wave. In this patient, the QT interval is 560 msec. The normal upper limit for the QT interval is 440 msec in men and 460 msec in women. This electrocardiogram compares with Figure 1 showing a normal QT interval.
FIGURE 3.
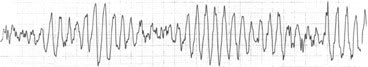
Electrocardiogram showing torsades de pointes. Note the more or less symmetric variation in the ventricular tachycardia waves. Torsades de pointes may resolve into sinus rhythm or progress into ventricular fibrillation.