
Family medicine career benchmark dashboard
Know your worth with the AAFP's comprehensive data on family physician salaries and other key metrics.

View career data from more than 8,500 family physicians who completed the 2025 survey.
Imagine arming yourself with real data specifically for family physicians—including compensation, benefits and job satisfaction details—as you make future career decisions. That's exactly the information you'll get from the family medicine career benchmark dashboard, available for free to AAFP members.
Two ways to view the dashboard data
Members can choose from different formats when accessing data from the dashboard.
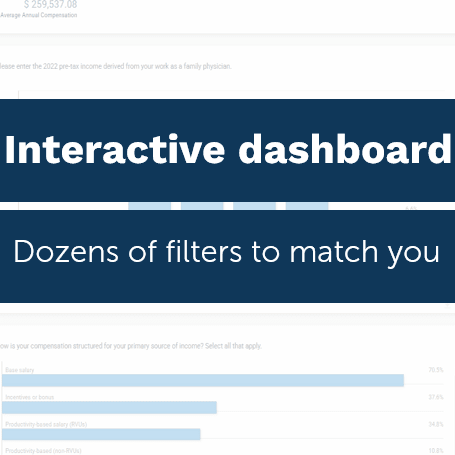
Interactive dashboard view
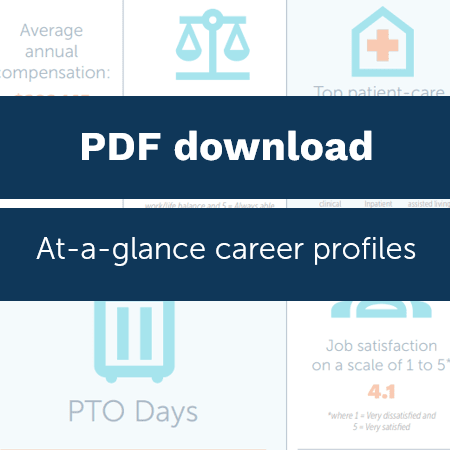
Digital download of key stats
About the career benchmark dashboard
The family medicine career benchmark dashboard is a first-of-its-kind tool for the specialty, providing comprehensive compensation and job satisfaction data.
As an AAFP member, you can use this dashboard to see how your income, benefits, career satisfaction and more compare to peers in similar roles by state. You'll see data like compensation structure, satisfaction by career path, amount of paid time off, funding for CME and sign-on bonus amounts.
See how the dashboard works
Why family medicine needs a career benchmark dashboard
New family physicians need support. Knowing what to expect can protect you from early-career burnout and give you confidence to demand compensation equal to the value you provide.
Pay transparency. The dashboard lets you filter by ethnic/racial identity, gender identity, geographic location and more.
Compensation isn’t everything. An ideal job should offer benefits beyond a high salary. Family physicians need to be able to see how different roles and settings might affect their well-being.
All family physicians should benefit from new payment policies. The AAFP has advocated to Congress, CMS and private payers for payment changes that benefit many family physicians; however, employed family physicians often must advocate for themselves to benefit from these advances. This dashboard equips members with the information they need to negotiate improved compensation.
This dashboard is one of a kind. There is no other comprehensive career benchmarking tool for family physicians to compare compensation, benefits and work environment in one place, helping you make informed career decisions and know your worth.
FAQs: Career benchmark dashboard
The dashboard’s salary and other data can help you establish a realistic perspective and develop a fair salary range for evaluating your compensation package. You can use the data as a benchmark to evaluate an employer’s offer or to make a counteroffer based on your value and expectations. You can also use the data to demonstrate your credibility and marketability by showing you have done your research and are aware of industry standards and trends.
While the compensation and other data in the dashboard can be a powerful tool for your negotiation, you should not rely on it alone. You should also consider other factors, such as the employer's budget and needs, the demand for and supply of your skills, the total package of benefits and perks offered, and the work environment and culture.
Finally, please note that information provided by the AAFP is not a suggestion, invitation, direction or recommendation as to what you should ask for or what you should be paid. You must make that determination based on factors including the following:
- Your own needs
- The employer’s needs
- Your skills and experience
- Regional and/or practice-specific circumstances
- Total benefits package
- Other terms and conditions of employment offered
- Your business judgment
- Other factors within your discretion
The dashboard is intended to increase the quality and availability of relevant information in the field of family medicine as a means to enhance—not suppress—competition for the patient care and services that family physicians provide.
The survey questions were developed by a panel of AAFP staff and reviewed by members of the AAFP Commission on Quality and Practice. Questions were compiled from several sources, including the YM Careers template survey, AAFP Practice Profile, ABFM Diplomate Survey and AAFP Member Survey. Three members piloted the survey while AAFP staff observed and asked questions about their interpretation of questions. In 2025, some survey questions were added or revised based on member feedback submitted after the dashboard launched. The updated survey was reviewed by the AAFP Commission on Quality and Practice and piloted by four members.
2025 survey distribution and response
The online survey, administered by SurveyMonkey (San Mateo, CA), collected anonymous responses from July 21 to December 15, 2025. All active members (not currently a student, resident or retired) with valid email addresses received an email with a link on August 1, 2025. The survey link was also posted on the AAFP website and distributed through social media channels, online communities, at in-person AAFP and chapter events and in two additional member-wide emails.
There were 8503 total responses, The following respondents compensation data was removed from the dataset:
- Incorrectly answered our trap question1
- Reported an income of less than $5000
The final sample of 8503 physician respondents represents 13.1% of active AAFP membership, which is statistically significant with a 95% confidence interval and a 3% margin of error.
Survey responses for all AAFP state and U.S. territory chapters exceeded 10% of membership, with the exception of the U.S. Virgin islands with a response rate of 7.69%. All other response rates ranged from 10.14% to 34.29%. State-level results did not reach the level of statistical significance noted for the national results.
2023 survey distribution and response
The online survey, administered by SurveyMonkey (San Mateo, CA), collected anonymous responses from August 28 to November 14, 2023. All active members (not currently a student, resident or retired) with valid email addresses received an email with a link on September 1, 2023. The survey link was also posted on the AAFP website and distributed through social media channels, online communities, at in-person AAFP and chapter events, and in four additional emails.
There were 7,841 total responses, with the following respondents removed from the dataset:
- Incorrectly answered our trap question1
- Indicated they were retired in a text box
- Reported that their role as a family physician was not the main driver of their income
- Reported an income $0 - $1000
- Worked 5% FTE (full-time equivalent) or less
- Worked part time (PT), but did not provide an FTE percentage
The final sample of 7,535 physician respondents represents 10.2% of active AAFP membership, which is statistically significant with a 95% confidence interval and a 3% margin of error.
Survey responses for all AAFP state and U.S. territory chapters exceeded 5% of membership, with response rates ranging from 5.91% to 32.42%, except Guam (3.57%). While all responses are presented in the dashboard, state-level results did not reach the level of statistical significance noted for the national results.
Dashboard use
The information in this survey is intended to help AAFP members explore career opportunities within family medicine and build a general understanding of the family physician compensation, benefit, and career satisfaction landscape. It is not intended for other uses.
1. SurveyMonkey. Trap questions. SurveyMonkey. Accessed December 5, 2023. https://help.surveymonkey.com/en/surveymonkey/create/trap-questions/
The dashboard collected anonymous information from more than 8,500 family physicians about the following:
- Geographic location
- Personal demographics
- Professional roles, practice setting and workforce experience
- Pre-tax compensation and bonuses
- Benefits and paid time off
- Scheduling
- Burnout
- Clinical autonomy
This information was collected in 2025.
Career Benchmark Dashboard 2023 and 2025 survey respondents’ self-reported demographics (years since residency, degree obtained and race/ethnicity) closely align with both AAFP membership and the ABFM Family Medicine FactBook (FactBook). There were more early career physicians (1-3 years since residency) who responded in 2023 (17.50%) than in 2025 (11.10%) and more later career physicians (over 30 years since residency) who responded in 2025 (17.80%) than in 2023 (13.40%).
The slight variations between racial and ethnic representation between the three data sources is negligible. However, the Career Benchmark Dashboard respondents have a notable variation in gender. While female physicians represent 45.6% of family physicians in the FactBook and 48% of AAFP membership, they made up 54.2% of survey respondents in 2023 and 52.3% of respondents in 2025.
This information was collected in 2025. The survey solicited 2024 data from respondents.
The dashboard is only available to AAFP members, who can access it anytime free of charge.
Once you log in to view the dashboard, you’ll see an overview screen with national-level information, including total responses, average salary, role satisfaction, and work and position information.
To learn more about any of the six sections, click the “Explore” links on the overview screen. Once you are in a specific screen, select one or more filters to narrow the data. Each filter has multiple selectable options. Multiple filters and multiple categories can be used simultaneously.
Please note: A privacy screen will prevent certain data from being viewed if the applied filters bring the information down to 10 or fewer responses. This guard helps protect the privacy of those who responded to the survey. Changing filters may help to explore the data. For example, if exploring data for one state with a gender identity filter and a race/ethnicity filter applied activates the privacy guard, it may be helpful to select a grouping of states in the region of interest. This provides a larger pool of responses to explore.
The AAFP does not recommend you apply filters like state, primary position and employer and then take that average compensation number with you to the negotiation table for your next contract. Rather, this survey can give you a sense of how other family physicians were paid in 2024—both the average and the distribution. The dashboard cannot put the average compensation in context with a total benefits package or how a compensation package is structured.
The data in the dashboard can help you see how your current or offered compensation generally compares to what survey participants reported.
The AAFP has resources on employment contracts and negotiation that can help prepare you to evaluate your career opportunities as you seek fulfilling and fairly compensated work that recognizes your worth to the health of patients.
If you want to seek improvements to your current work arrangement or a contract, the following negotiation resources can help you prepare: